Livermore Real Estate Market Update | September 2026
Market Update
Market Update
Livermore Real Estate Market Update September 2026
Pricing Precision Shapes the Early Fall Market
Livermore’s September 2026 market report points to a balanced but selective market. Inventory has flattened at 155 active single-family homes, while pending sales rose to 79 and the absorption rate reached 51%. Roughly half of the available inventory is finding a buyer in a month, but the results are increasingly divided by pricing and speed.
Homes that sold in fewer than 15 days averaged 102% of their original list price. Once a sale took more than 30 days, the average fell to about 94%. The message is straightforward: buyer demand is present, but it is concentrating on homes that enter the market with the right price, preparation, and presentation.
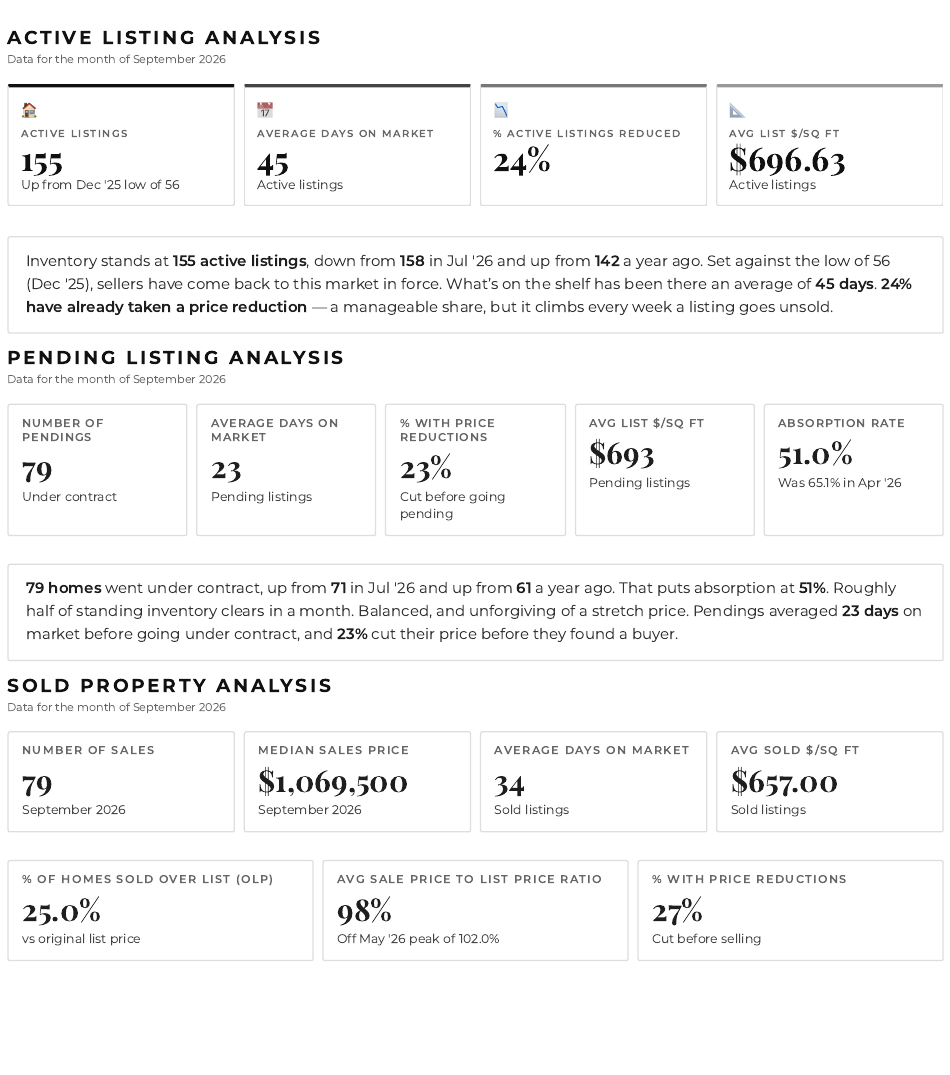
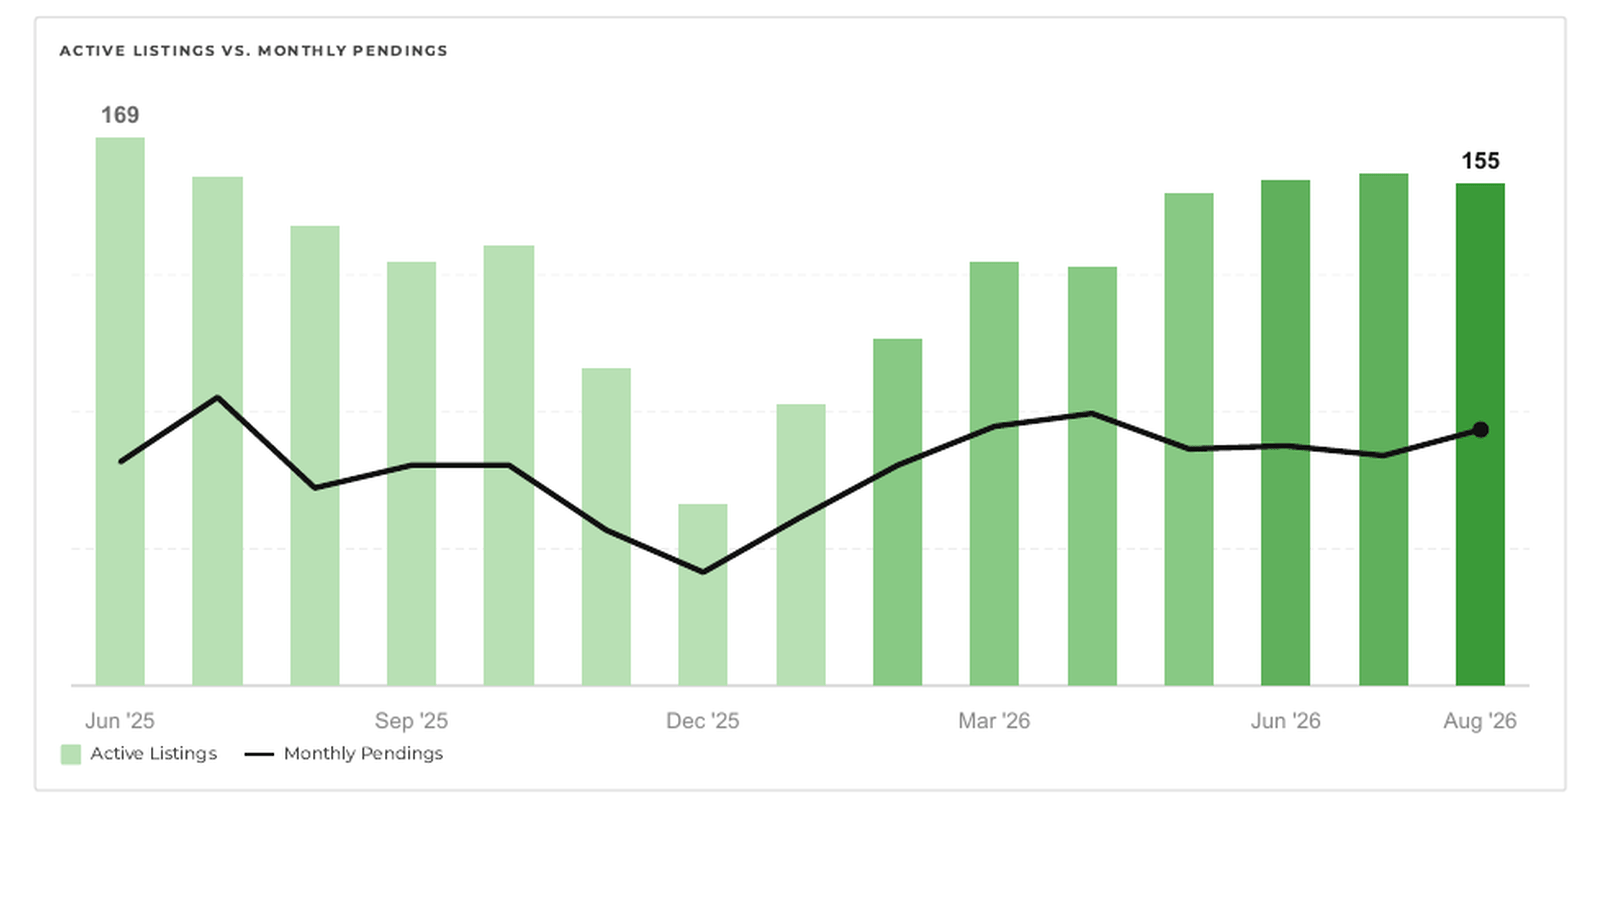
Livermore had 155 active single-family listings in the September report, down slightly from 158 in July 2026 but above the 142 listings recorded a year earlier. Inventory remains far above the December 2025 low of 56 homes, giving buyers more choice than they had during the winter.
The quality of that inventory matters. Active listings had been on the market an average of 45 days, and 24% had already reduced their price. That suggests the market is not broadly weak. Instead, it is separating homes that align with current buyer expectations from homes that entered at an aspirational price.
Pending sales increased to 79, up from 71 in July and 61 one year earlier. The resulting 51% absorption rate means pending activity equaled about half of active inventory. Pending homes averaged 23 days on the market, and 23% required a price reduction before securing a buyer.
This is a functional market with real demand, but buyers are comparing value carefully. Homes that are well positioned can still attract prompt attention. Listings that miss the market may need more time and a price adjustment.
The strongest finding in the report is the relationship between time on market and sale price. Homes selling in fewer than 15 days averaged 102% of their original asking price. Homes selling in 15 to 30 days averaged 99%. The ratio dropped to 94% for sales taking 31 to 60 days and 93% for sales taking more than 60 days.
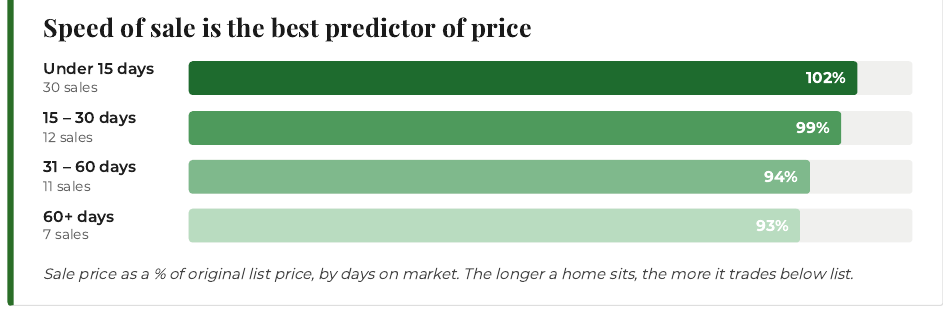
Source visual reproduced from the Livermore Market Pulse Report, September 2026.
Time itself does not cause a lower price, but it is a strong indicator of whether a home was positioned correctly when it launched. The first days on the market typically bring the largest pool of attentive buyers. When the initial price creates engagement, sellers are more likely to preserve leverage.
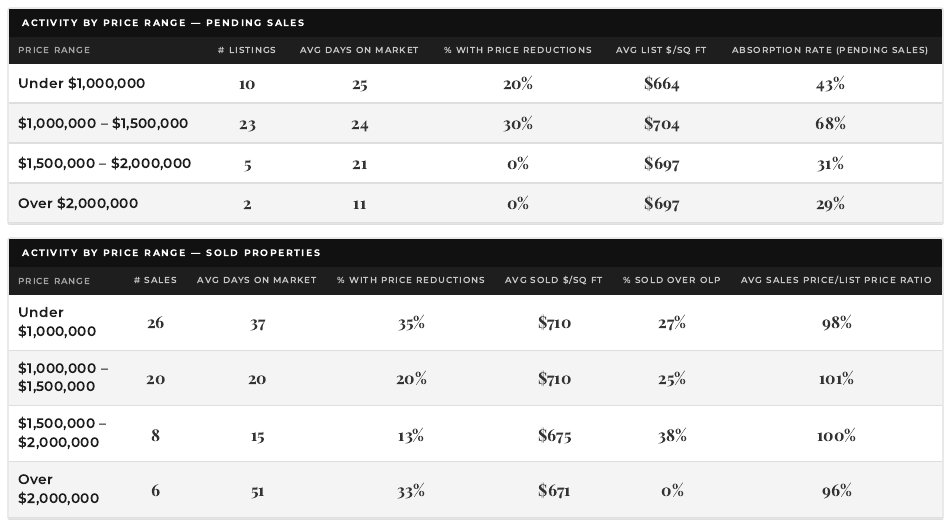
The report recorded 79 closed sales at a median price of $1,069,500. The average closed price was $657 per square foot, and the average home sold for 98% of its original list price. One-quarter of sales closed above the original asking price, while 27% reduced their price before selling.
Performance varied by price range. Sales from $1 million to $1.5 million averaged 101% of original list price. The $1.5 million to $2 million segment averaged 100%, while sales above $2 million averaged 96% and took an average of 51 days. Because the price-range tables cover subsets of the full market, their category totals do not equal the report-wide totals.
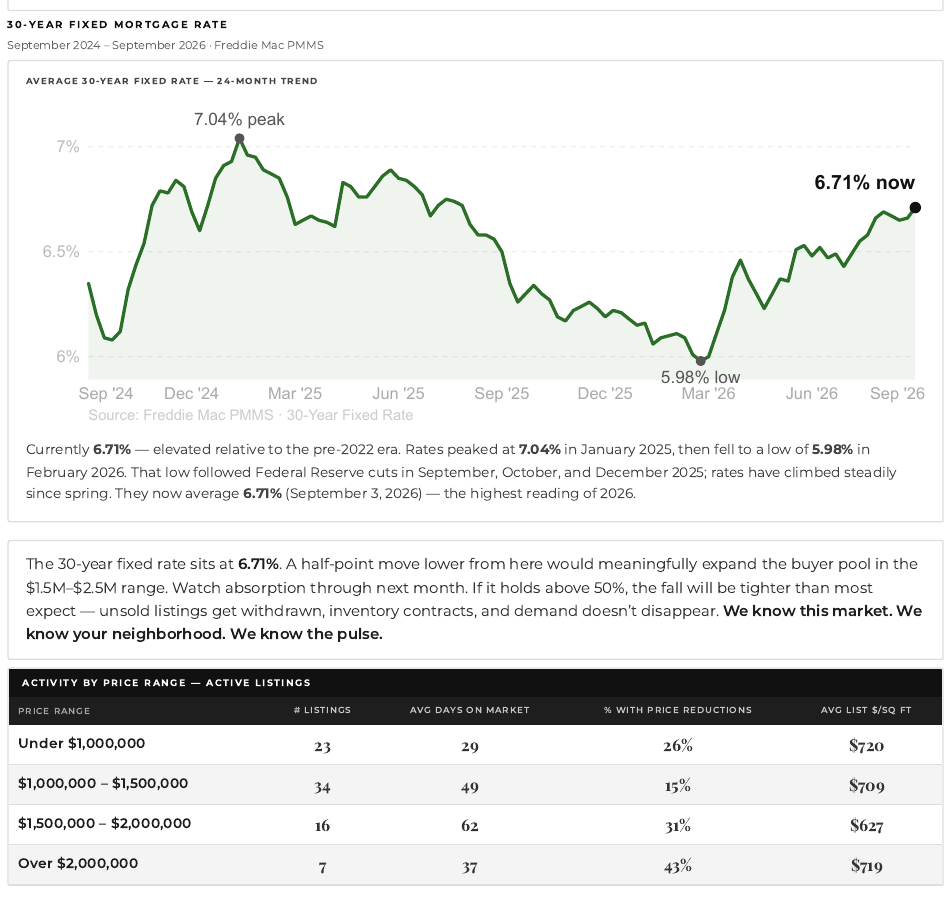
The report cites a 6.71% average 30-year fixed mortgage rate as of September 3, 2026, based on Freddie Mac’s Primary Mortgage Market Survey. That was the highest reading of 2026 after rates reached a 5.98% low in February. Elevated borrowing costs continue to shape affordability and keep many buyers payment-sensitive.
A meaningful decline in rates could expand demand, particularly in the $1.5 million to $2.5 million range. Until then, buyers and sellers should evaluate the monthly payment, competing inventory, and neighborhood-level activity rather than relying on a single citywide headline.
Livermore sellers still have an opportunity to achieve a strong result, but the launch strategy matters. Current comparable sales should guide the asking price. Preparation and presentation should support that price, and marketing should create concentrated exposure during the first days on the market. The report’s 102% average for fast sales shows what can happen when those elements align.
Sellers should also establish a response plan before going live. If showings, inquiries, and second visits are below expectations, the market may be signaling a positioning issue. Acting early can be less costly than accumulating market time and negotiating after leverage has weakened.
Buyers have more choice and more negotiating room on listings that have been available for several weeks. Homes selling after more than 30 days averaged roughly 94% of original list price, creating potential opportunities for buyers who understand the seller’s position and the property’s competition.
That leverage does not apply equally to every home. A well-priced property can still sell quickly and above asking. Buyers should secure financing early, define their comfortable payment range, and be ready to act when a strong match enters the market.
The next signal to watch is whether absorption remains near or above 50% as seasonal inventory begins to contract. If pending demand holds while some unsold listings are withdrawn, the market could tighten even with mortgage rates remaining elevated. If absorption falls and days on market continue rising, buyers may gain additional leverage.
The most useful conclusion is not that Livermore is simply a buyer’s market or a seller’s market. It is a market that rewards precision. Price, condition, presentation, and timing are determining results more clearly than they were during the fastest parts of the cycle.
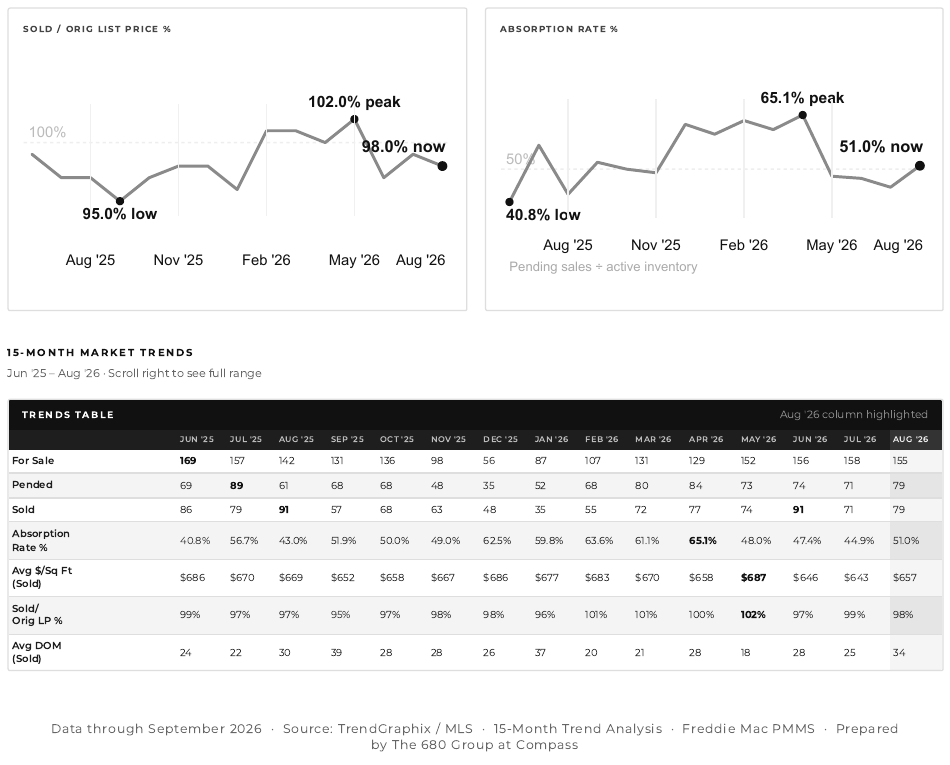
This update is based on the Livermore Market Pulse Report for single-family homes, prepared by The 680 Group at Compass using TrendGraphix/MLS data and Freddie Mac PMMS mortgage-rate data. The report is dated September 2026. Its 15-month trend series runs from June 2025 through August 2026, while the report’s headline dashboard is labeled September 2026. Metrics may reflect different listing cohorts, so active, pending, sold, and price-range totals should not be added together or treated as one identical population. Data is a market snapshot and may change as MLS records are updated.
If you are considering buying or selling a home in Livermore, the citywide numbers are only the starting point. Property type, neighborhood, condition, price range, competing inventory, and timing can materially change the strategy. Contact Doug Buenz and The 680 Group for a focused analysis of your home or target market.
Doug Buenz | The 680 Group at Compass
(925) 621-0680 | [email protected] | 680homes.com
Stay up to date on the latest real estate trends.
Market Update
Doug Buenz | September 19, 2026
Pricing Precision Shapes the Early Fall Market
Market Update
Doug Buenz | September 15, 2026
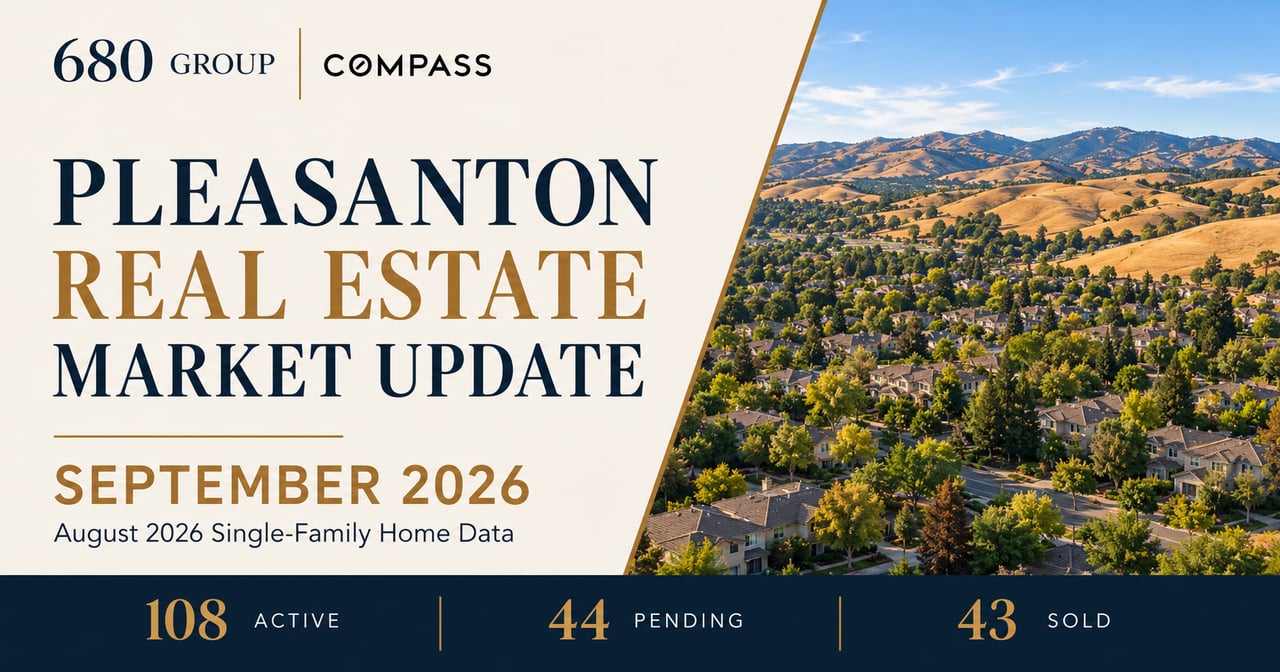
August 2026 single-family home data for Pleasanton, California, published September 2026

Doug Buenz | August 20, 2026
Dublin’s latest single-family home trends, including inventory, buyer demand, pricing, and days on market from July 15 through August 17, 2026.

Market Update
Doug Buenz | August 18, 2026
Pleasanton buyers have more choices, but well-priced homes can still sell at or above asking. Here’s what the latest single-family-home data means.

Market Update
Doug Buenz | August 18, 2026
South Livermore’s market is tight enough to reward decisive buyers, but recent closed sales show that sellers still need to price with discipline.

Market Update
Doug Buenz | August 7, 2026
August 2026 Update: Well-positioned homes sold quickly and averaged 102% of asking, while homes taking over 30 days averaged just 94%.

Pleasanton Real Estate
Doug Buenz | July 28, 2026
The most common reasons Pleasanton homes fail to attract offers—and what sellers should consider before relisting.

Market Update
Doug Buenz | July 21, 2026
More Inventory, Selective Buyers, and Uneven Results for Sellers

Market Trends
Doug Buenz | July 21, 2026
Single-family home activity included in the MLS snapshot from June 15 through July 20, 2026