Pleasanton Real Estate Market Update: Pricing Precision Defines the Early Fall Market
Market Update
Market Update
Pleasanton Real Estate Market Update: Pricing Precision Defines the Early Fall Market | September 2026
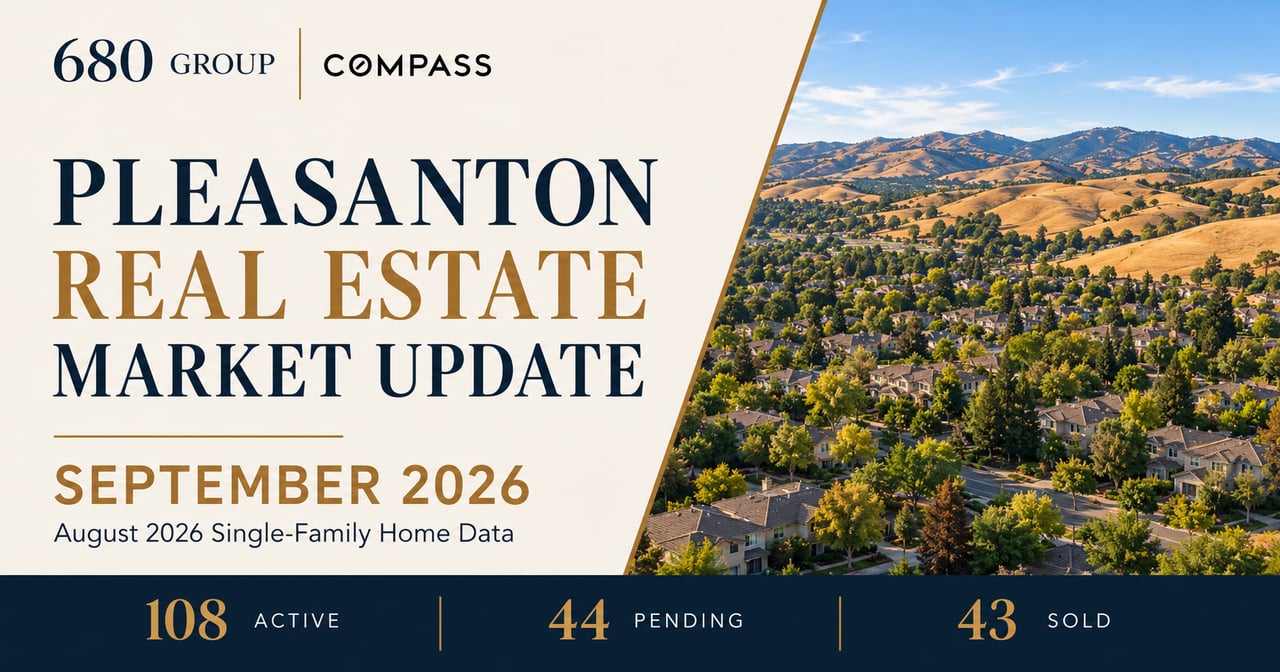
Pleasanton inventory has flattened heading into fall and edged lower for a second consecutive month. August ended with 108 active single-family home listings, 44 pending sales, and 43 closed sales. The absorption rate declined to 40.7%, meaning fewer than half of the available listings went under contract during the month. That is a market tilting toward buyers, although accurately positioned homes can still sell quickly and sometimes above asking price.
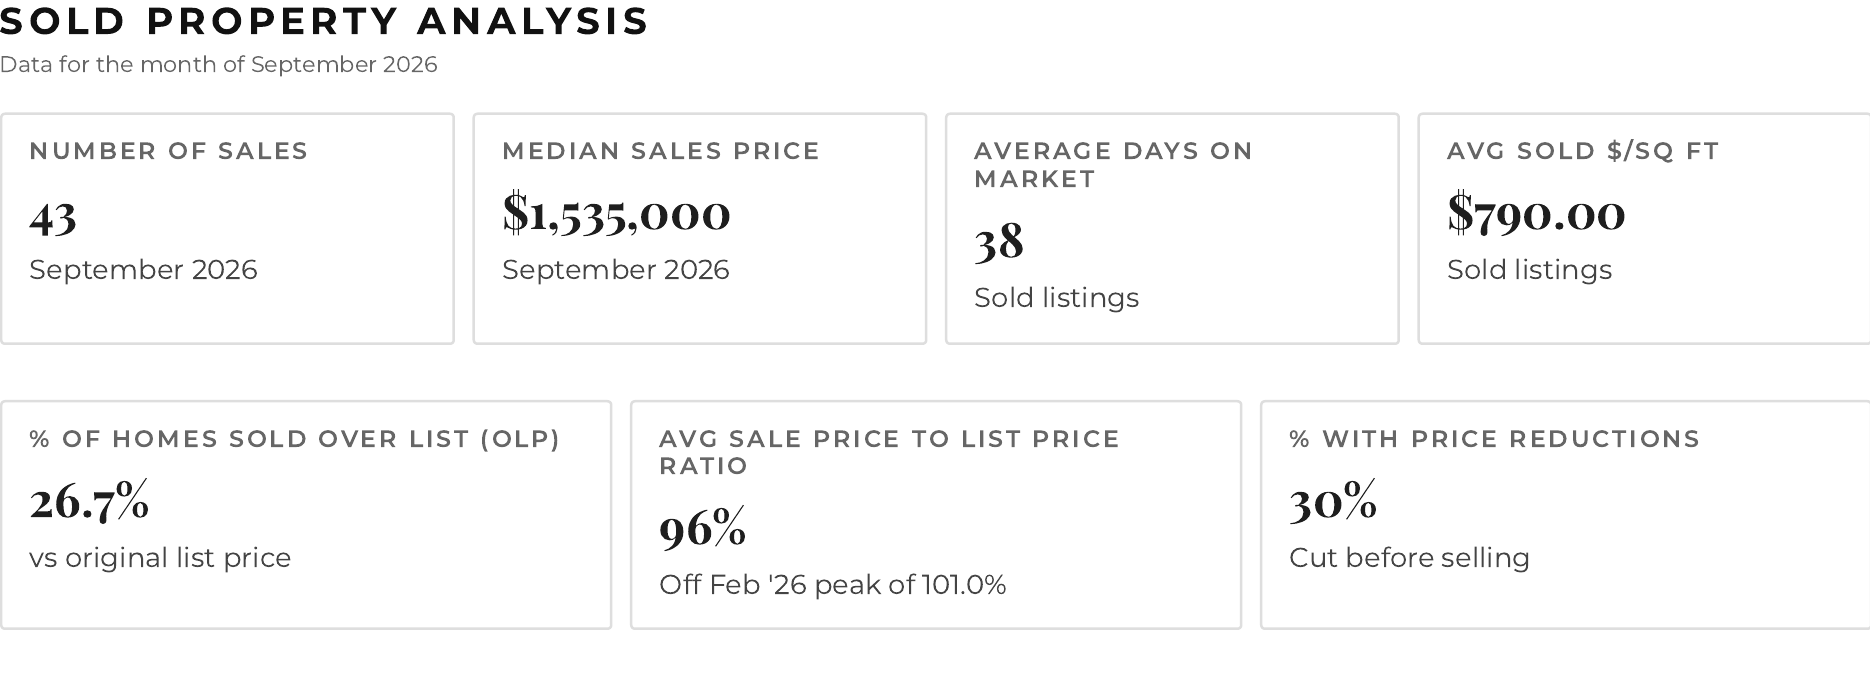
The number worth watching is the gap between what is listed and what is selling. Active listings had been on the market for an average of 50 days, while the homes that actually closed averaged 38 days. Among the 30 sales included in the report's original-list-price analysis, homes that sold in fewer than 15 days averaged 101% of their original asking price. Homes that remained on the market for more than 30 days averaged approximately 93% or less.
For Pleasanton sellers, the message is straightforward: price for engagement, not hope. Strong presentation and concentrated early marketing matter because buyers are increasingly selective and quick to move on. For buyers, longer-market-time listings may provide negotiating opportunities, but prime homes priced attractively can still move quickly.
Pleasanton Market at a Glance
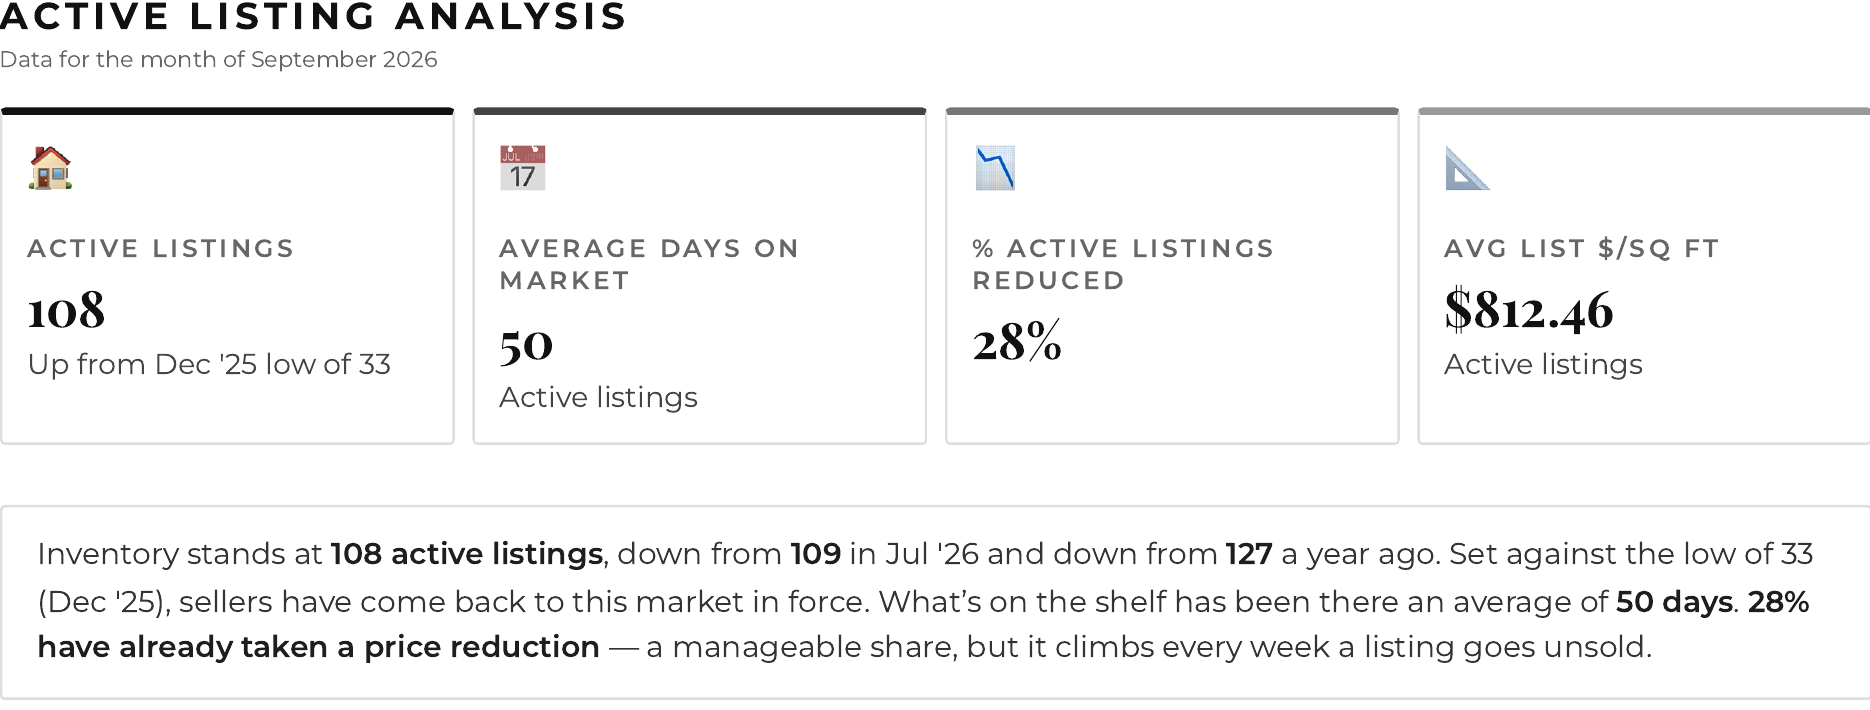
Pleasanton finished August with 108 active single-family home listings. Inventory edged down for a second consecutive month, from 112 in June and 109 in July. In my experience, this flattening is normal heading into fall. The total was also 15% below the 127 homes available in August 2025, but it remained substantially higher than the December 2025 low of 33 listings.
Active listings had been on the market for an average of 50 days, and 28% had already received a price reduction. Buyers have choices and are increasingly skeptical of aspirational pricing. The strongest listings can still attract prompt attention, while homes that fail to capture interest at launch are more likely to join the growing queue of listings competing through price reductions.
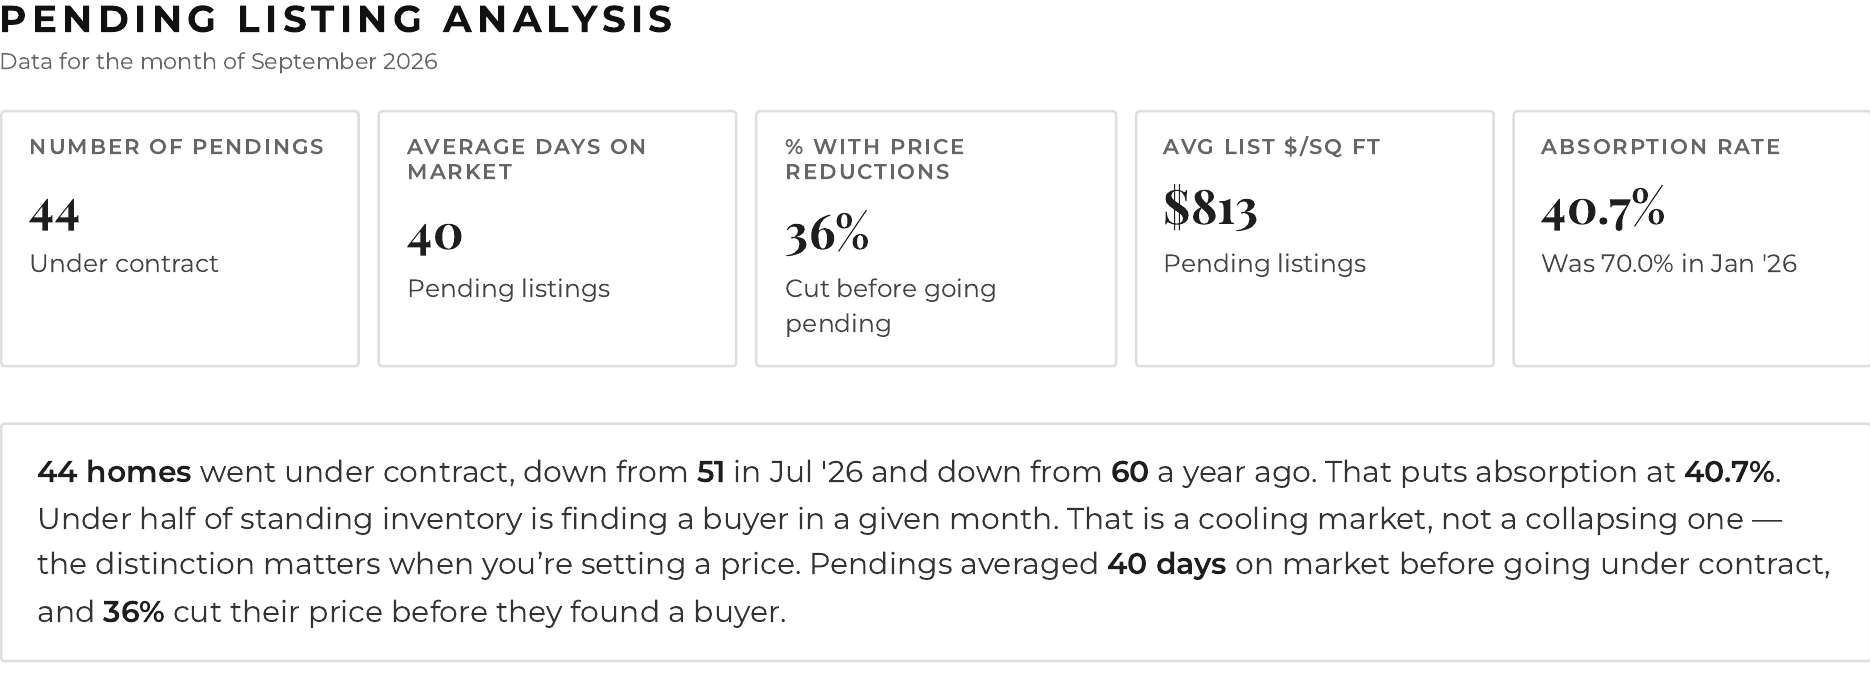
Forty-four Pleasanton homes went under contract in August, compared with 51 in July and 60 in August 2025. The resulting 40.7% absorption rate means pending sales equaled roughly four out of every ten active listings during the month.
Pending listings averaged 40 days on market, and 36% underwent a price reduction before securing a buyer. Those figures suggest that demand remains active but selective. Buyers have shorter attention spans and are engaging when a home's price, condition, and presentation align with current expectations. When a listing does not capture their attention, they are often moving quickly to the next option.
Home Prices and Sale-to-List Performance
The speed-of-sale data provides the clearest view of current pricing sensitivity.
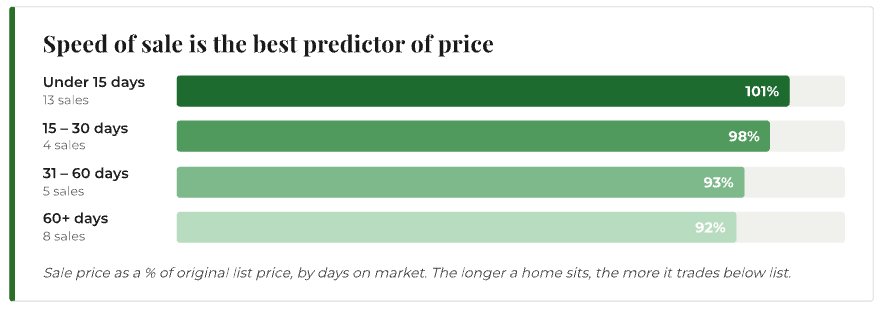
Market time does not independently cause a lower sale price, but it is often evidence that buyers did not accept the initial positioning. A slow start can weaken urgency, invite comparisons with newer inventory, and make later negotiations more difficult. Thirty percent of the 30-sale analytical subset had a price reduction before closing.
Days on Market and Price Reductions
The speed-of-sale data provides the clearest view of current pricing sensitivity.
Market time does not independently cause a lower sale price, but it is often evidence that buyers did not accept the initial positioning. A slow start can weaken urgency, invite comparisons with newer inventory, and make later negotiations more difficult. Thirty percent of the 30-sale analytical subset had a price reduction before closing.
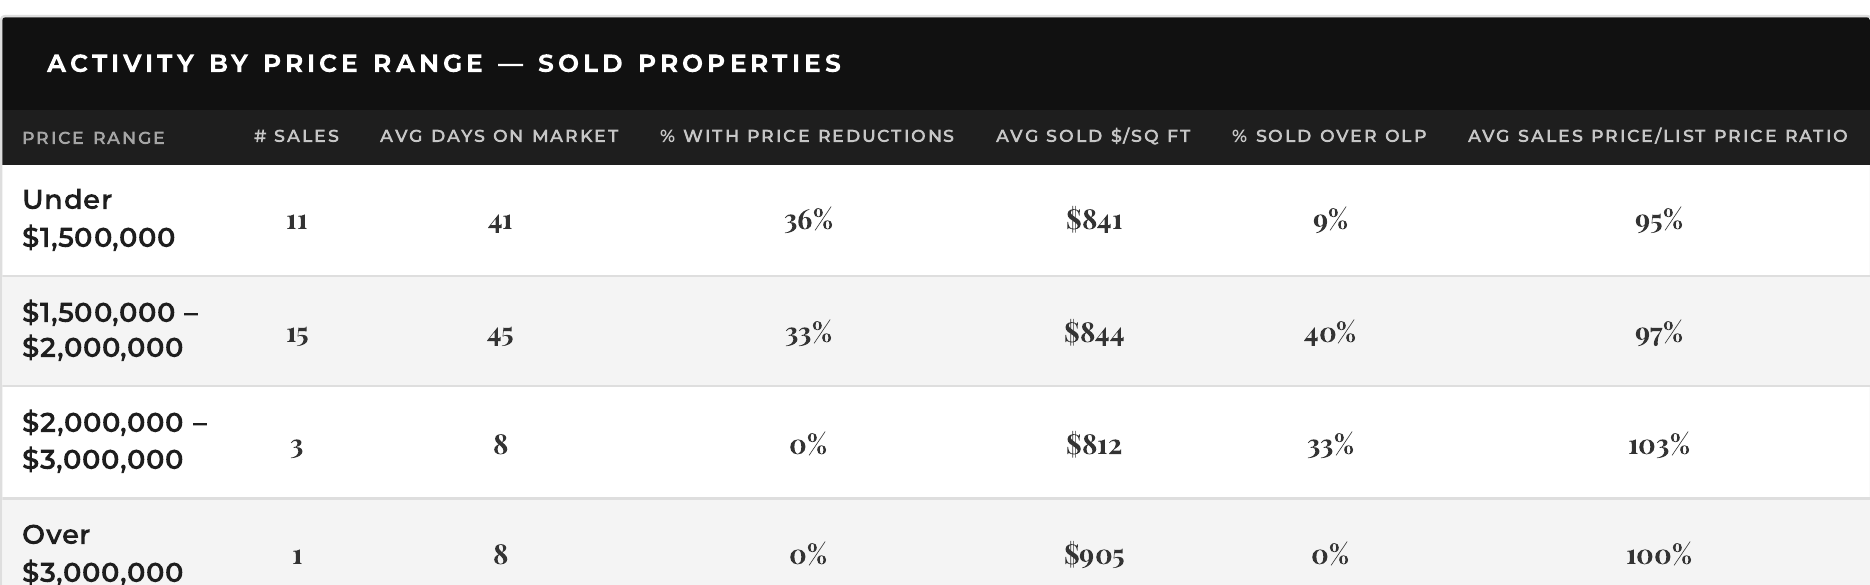
The following visuals are incorporated directly from the September report. Because the category counts total fewer properties than the overall market totals, they should be read as reported analytical subsets rather than a complete accounting of all 108 active, 44 pending, and 43 sold properties.
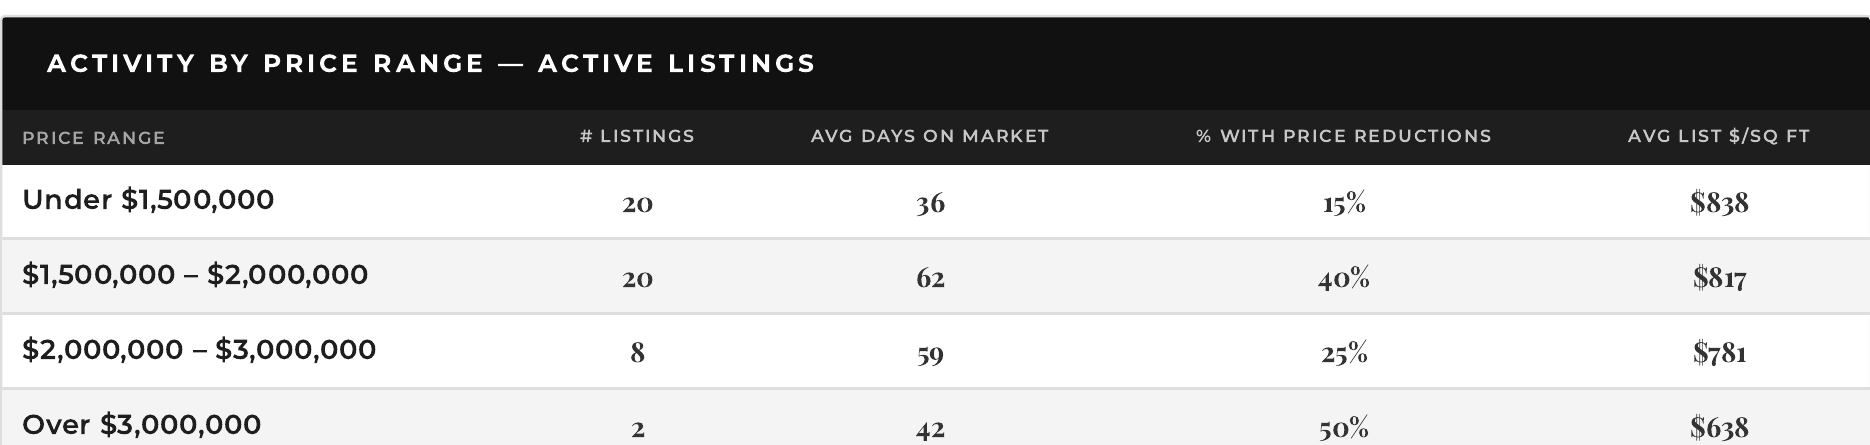
The $1.5 million to $2 million segment showed the longest average market time at 62 days, with 40% of active listings reduced. The reported luxury segment above $3 million contained only two listings, making its percentages especially sensitive to individual properties.
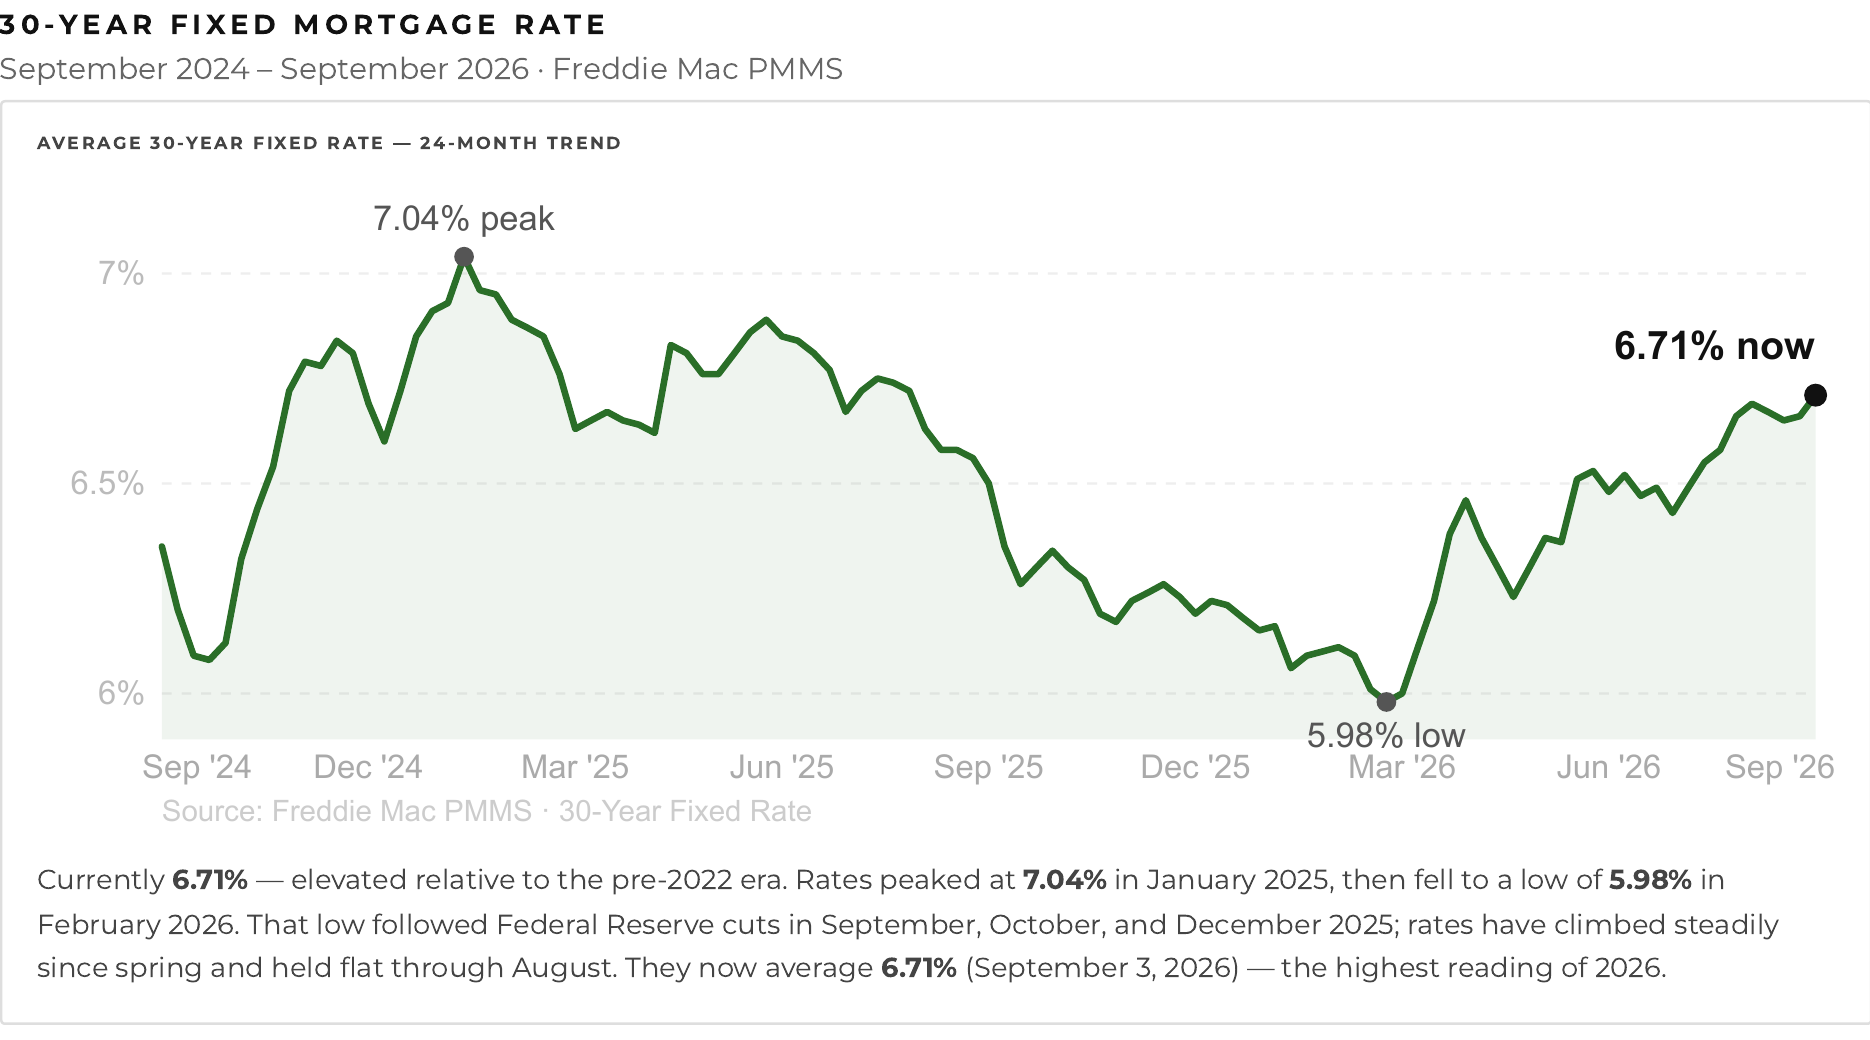
The report places the average 30-year fixed mortgage rate at 6.71% as of September 3, 2026, based on Freddie Mac's Primary Mortgage Market Survey. That level remains elevated relative to the pre-2022 era. Rates peaked at 7.04% in January 2025, reached a low of 5.98% in February 2026, and then climbed through the spring and summer. The September 3 reading was the highest reported rate of 2026 through that date.
What This Means for Pleasanton Home Sellers
Pleasanton is still rewarding sellers who get the launch right. More than one-quarter of the analyzed closings sold above original list price, while more than one-quarter of active listings had already reduced their asking price. The market is no longer rewarding wishful pricing. A home priced for engagement can still move quickly; a home priced to hope risks losing buyer attention and joining the queue of reduced listings. What I am seeing now is that buyers are skeptical and have increasingly short attention spans. If a listing does not capture their attention, they move on to the next one.
For sellers, the highest-impact priorities are:
Price for engagement using current buyer behavior and competing listings, not hope or an earlier market peak.
Complete preparation before going live so the home makes its strongest impression immediately.
Use professional photography, video, digital presentation, and targeted exposure to build early engagement.
Evaluate showing activity and buyer feedback quickly rather than waiting for market time to solve a positioning problem.
Treat the first two weeks as the most important window for creating urgency and competition.
Buyers have more room to be selective than they did during the most competitive periods of early 2026. Active listings averaged 50 days on market, and homes that took more than 30 days to sell closed at meaningfully lower percentages of their original list prices in the report's analytical subset. Many longer-market-time properties may therefore offer room to negotiate.
That does not mean every home will sit or every seller is highly negotiable. Condition, location, competition, and the seller's circumstances still matter. Buyers should get fully pre-approved, remain patient, and be prepared to act decisively when a prime home enters the market at an attractive price. Assuming every listing will linger can mean losing the strongest opportunities. The best-positioned properties can still generate competition.
Pleasanton's early fall market is increasingly price sensitive and tilting toward buyers. Inventory has flattened and edged down for two months, while pending sales and absorption have weakened. With fewer than half of available listings going under contract in August, buyers have more choice and leverage. The market is not collapsing; it is separating well-positioned homes from listings that require a price adjustment to regain attention.
The next indicators to watch are mortgage rates, September absorption, and the number of unsold listings withdrawn as the fall progresses. If inventory contracts seasonally while absorption improves, sellers could regain some leverage. If rates remain elevated and pending activity stays below 50% of active inventory, buyers are likely to retain negotiating power on homes with extended market time.
The strategic conclusion is clear: Pleasanton is rewarding engagement, not wishful pricing. Sellers need a disciplined launch that captures attention immediately. Buyers can be patient, but they still need preparation, local context, and the ability to move quickly when a compelling home is priced correctly.
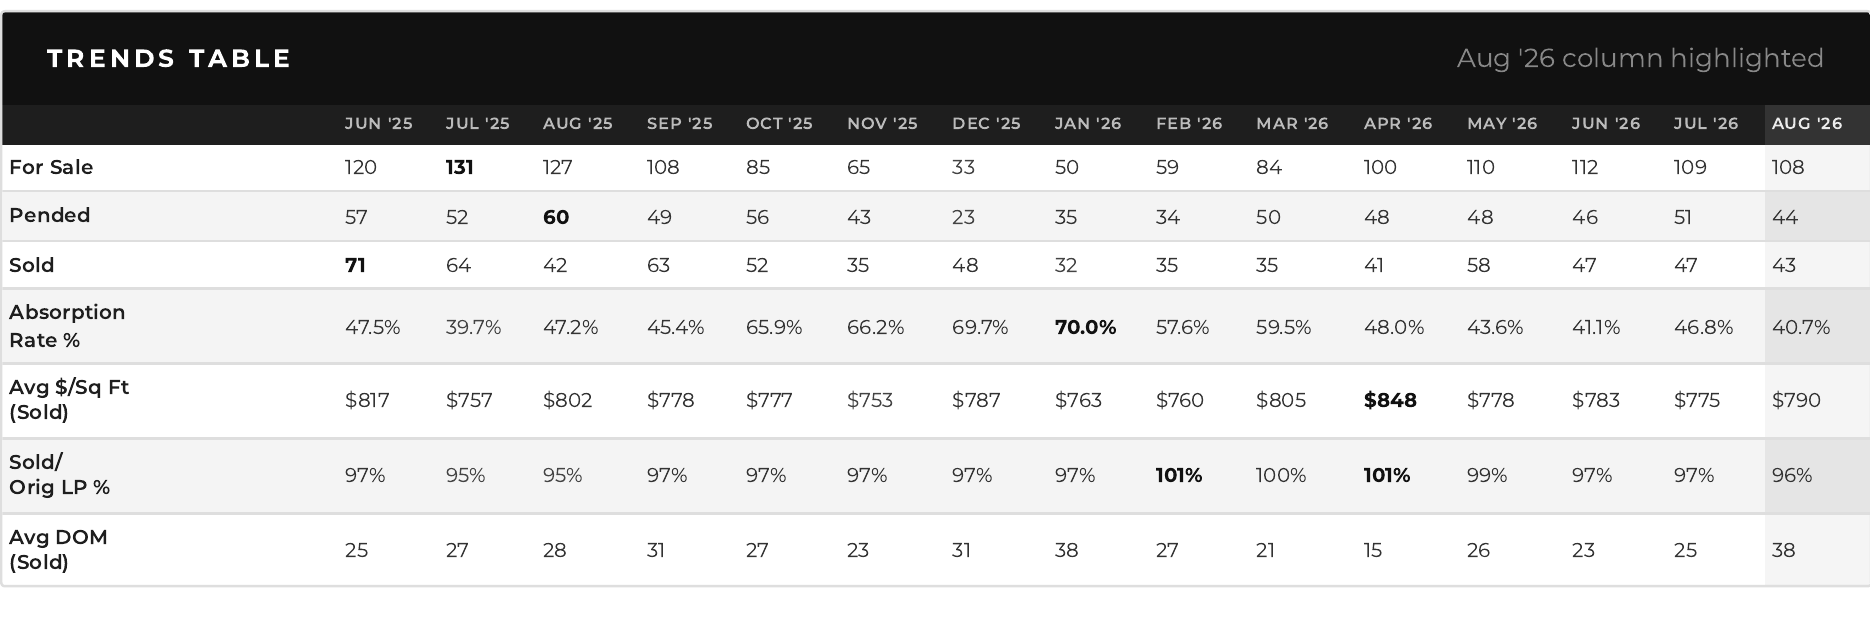
This update covers Pleasanton, California, single-family homes using data through August 2026. Market statistics and the 15-month trend analysis were supplied in the Pleasanton Market Pulse Report prepared by The 680 Group at Compass using TrendGraphix/MLS data. Mortgage-rate context is from the Freddie Mac Primary Mortgage Market Survey and reflects the report's September 3, 2026 reading.
Absorption is calculated as monthly pending sales divided by active inventory. Statistics may change as MLS records are updated. Averages can also be influenced by property mix and small sample sizes. The price-range tables and several original-list-price measures use smaller analytical subsets than the overall active, pending, and closed totals; those subset sizes are identified where relevant.
Market averages are useful, but the right strategy depends on your neighborhood, price range, property condition, and timing. For a confidential conversation about your Pleasanton real estate plans, contact Doug Buenz and The 680 Group at Compass.
Doug Buenz | The 680 Group
Phone: (925) 621-0680
Email: [email protected]
Website: 680homes.com
Information is deemed reliable but not guaranteed. This report is provided for general informational purposes and is not a substitute for financial, legal, tax, or lending advice.
Stay up to date on the latest real estate trends.
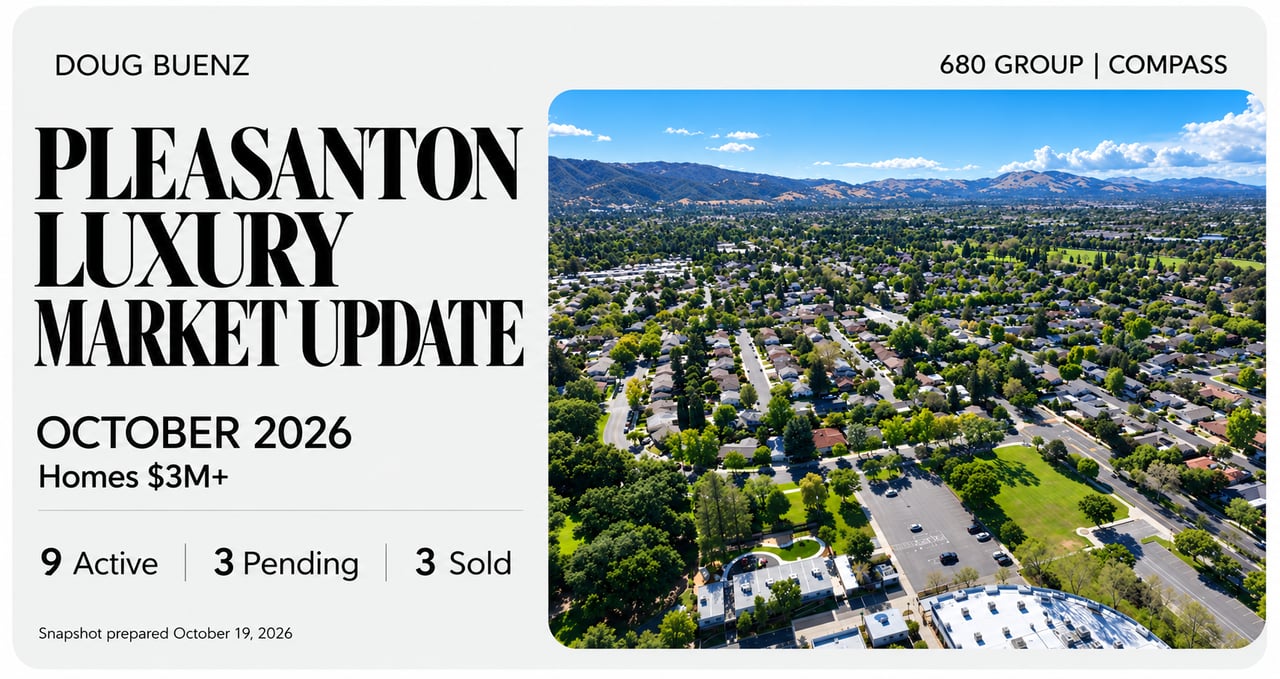
Pleasanton luxury real estate
Doug Buenz | October 23, 2026
Two distinct markets: Limited inventory below $4 million, more choices at higher prices, and why strategic pricing matters.
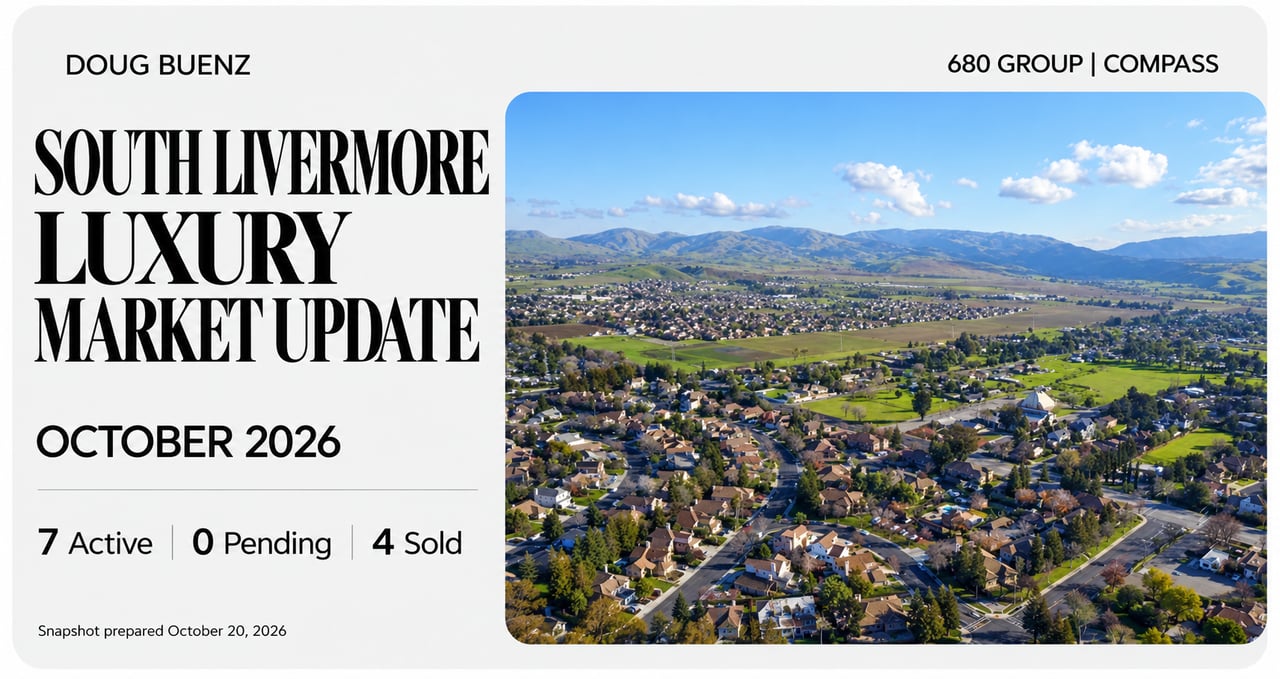
South Livermore
Doug Buenz | October 22, 2026
Seven luxury homes are on the market in South Livermore, with no pending sales. Four closings show how time on market relates to sale-to-list results.
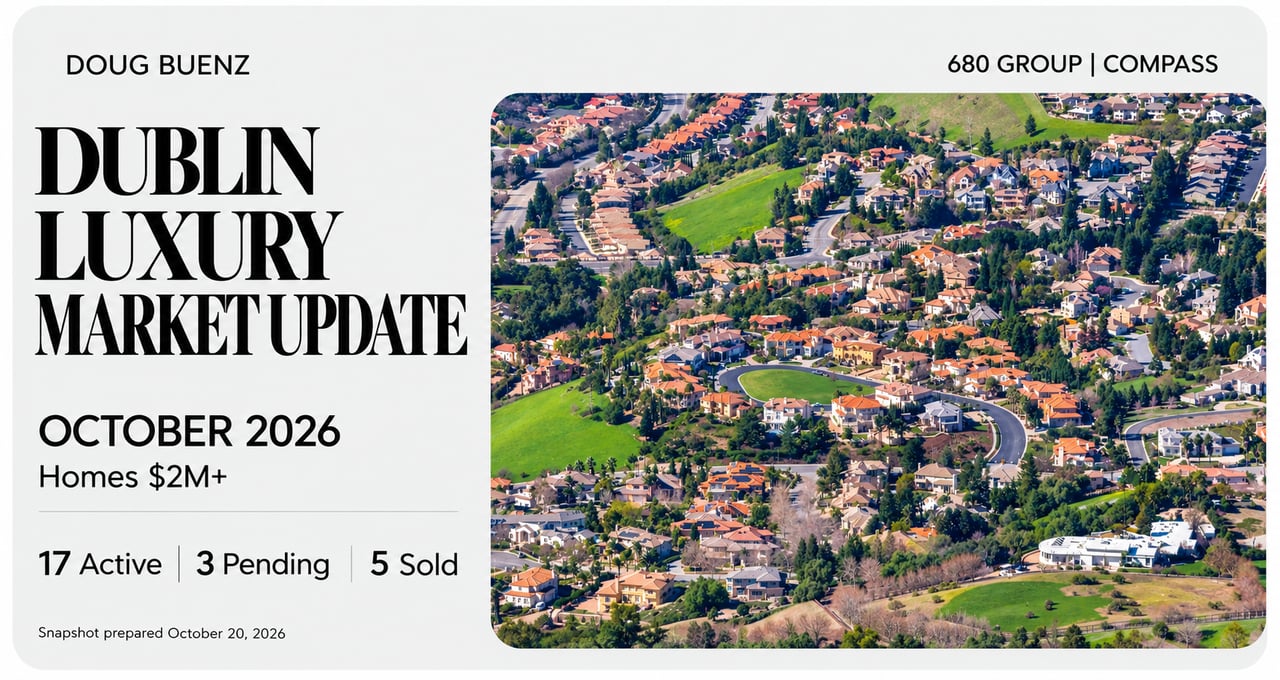
Tri-Valley real estate
Doug Buenz | October 21, 2026
Seventeen active listings and five closings highlight the importance of property specific pricing
Market Update
Doug Buenz | October 16, 2026
Inventory has leveled off, buyer activity has slowed, and accurate pricing is becoming increasingly important.
Market Update
Doug Buenz | October 12, 2026
Inventory has leveled off, buyer activity has slowed, and strategic pricing continues to shape results.

Market Update
Doug Buenz | October 9, 2026
Well-priced homes are selling quickly, while longer market times give buyers more negotiating room.
Market Update
Doug Buenz | September 21, 2026
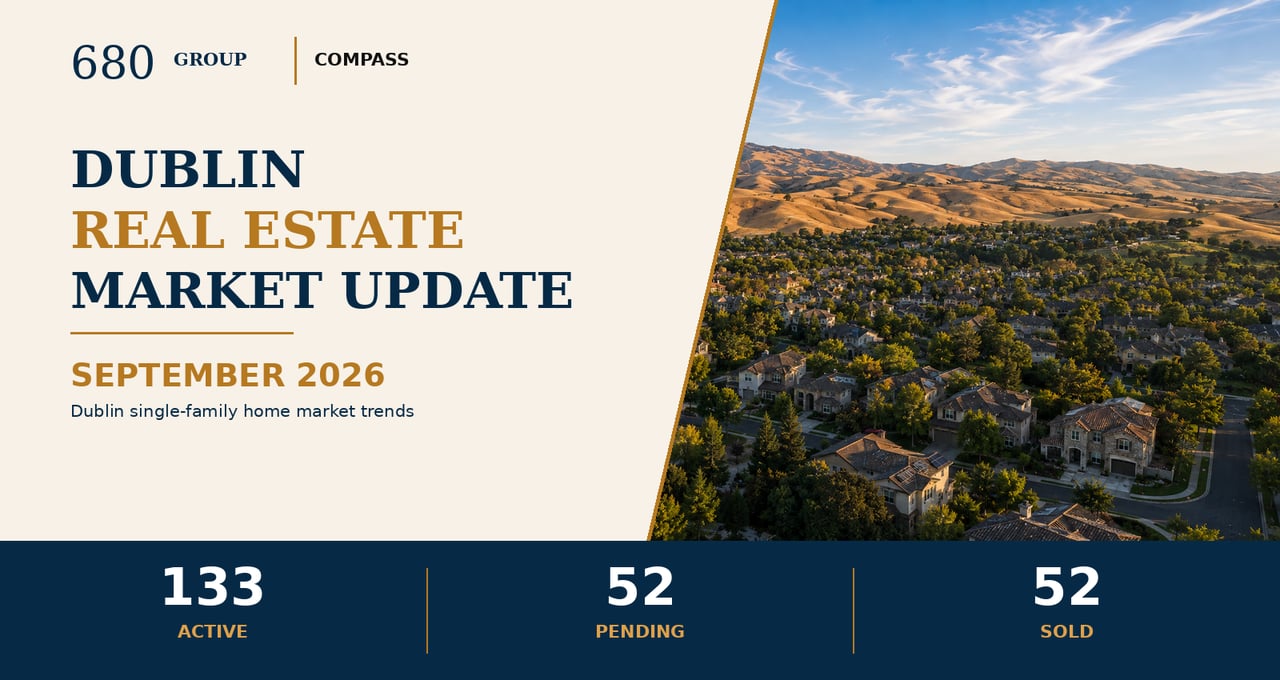
Inventory remains elevated, absorption stays below 40%, and Dublin buyers are separating well-positioned homes from listings that miss the market.
Market Update
Doug Buenz | September 19, 2026
Pricing Precision Shapes the Early Fall Market
Market Update
Doug Buenz | September 15, 2026
August 2026 single-family home data for Pleasanton, California, published September 2026