Pleasanton Real Estate Market Update: June 2026
Market Update

Market Update
Reporting period: June 1–30, 2026
Property type: Pleasanton single-family homes
Pleasanton’s housing market isn’t simply strengthening or weakening. It is becoming more selective.
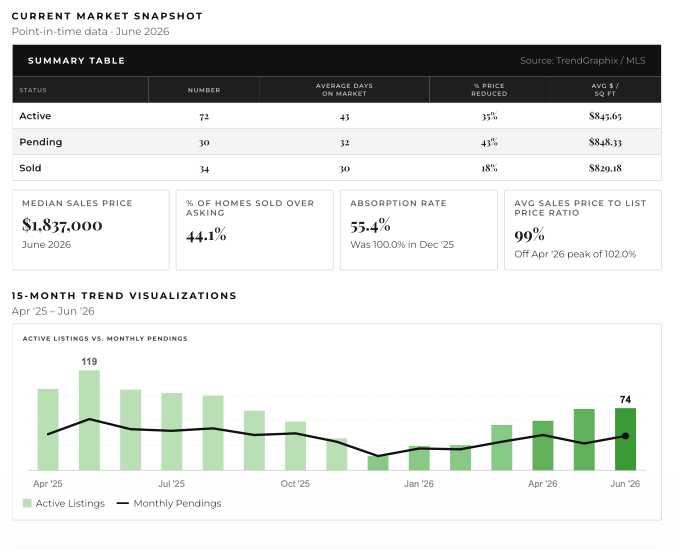
Inventory has increased substantially from the unusually low levels recorded in late 2025, giving buyers more homes to consider and reducing the urgency surrounding some listings. At the same time, properly priced and well-presented homes are still attracting strong interest. During June, 44.1% of closed sales finished above asking price.
The contrast is important: 35% of active listings had already received a price reduction, while nearly half of sold homes closed over asking. This is a divided market in which pricing, preparation, presentation, and marketing strategy can significantly influence the outcome.
The report’s point-in-time snapshot recorded the following market conditions:
These figures provide a snapshot of listing conditions when the report was prepared. They should not be interpreted as the final monthly totals shown in the preceding table.
Pleasanton buyers had considerably more inventory to choose from in June than they did at the end of 2025.
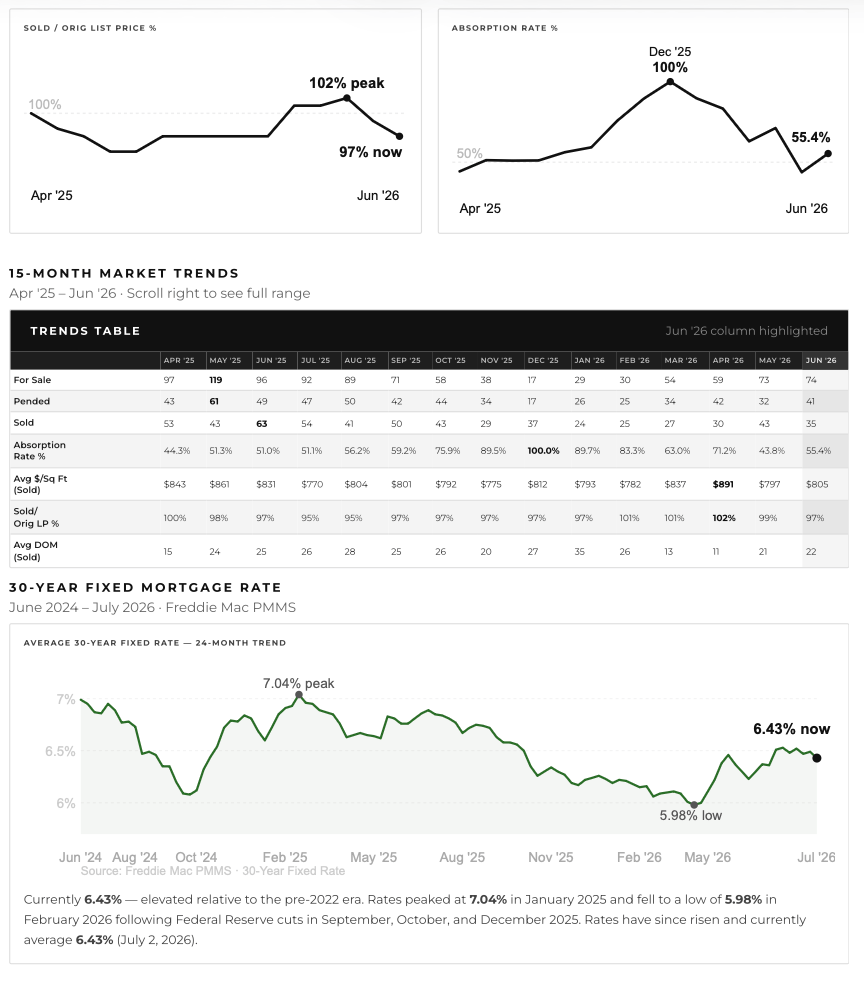
The monthly trend series recorded 74 homes for sale in June, compared with only 17 in December 2025. That represents an increase of more than 335% from the December low, although December is typically one of the least active listing periods of the year.
Inventory also edged higher from 73 homes in May. However, it remained well below the 119 homes available in May 2025.
This indicates that supply has recovered from its winter low without reaching unusually high levels. The market is better supplied, but it is not broadly oversaturated.
The practical effect is more choice for buyers and more competition among sellers. Homes must now compete directly against other available properties based on price, condition, presentation, location, and perceived value.
Buyer activity improved in June, with 41 homes entering pending status, up from 32 in May. That was the strongest monthly pending total since April, when 42 homes went pending.
The June absorption rate was 55.4%, calculated by comparing 41 pending sales with 74 homes for sale. This was an improvement from 43.8% in May but significantly below the 100% rate recorded in December, when inventory and pending sales were both unusually low.
A 55.4% absorption rate suggests that demand remains meaningful but is no longer strong enough to absorb every available home quickly. Buyers are active, but they can afford to be more selective.
For sellers, attracting attention is only the first step. A home must also compare favorably with competing listings when buyers evaluate price, upgrades, condition, and overall presentation.
The median sales price for a Pleasanton single-family home was $1,837,000 in June.
Closed sales averaged $805 per square foot, up slightly from $797 in May but below April’s $891. Price-per-square-foot figures can vary depending on the size, location, condition, and price range of the homes sold during a particular month, so they should not be treated as a direct measure of appreciation.
The average sale-to-original-list-price ratio was 97%, down from 99% in May and the 102% peak recorded in April.
This means that June sellers, in aggregate, accepted approximately 3% less than their original asking prices. However, the average masks a substantial difference between correctly positioned properties and listings that required adjustments.
Approximately 44.1% of June sales closed above asking price. Competitive bidding therefore remains possible, but it is concentrated among the homes buyers perceive as offering the strongest combination of value, condition, location, and presentation.
Homes sold during June spent an average of 22 days on the market, compared with 21 days in May and only 11 days in April.
The point-in-time snapshot showed that active listings had been on the market for an average of 43 days. It also showed that 35% of active listings had received a price reduction.
Those numbers reveal the market’s growing divide:
Some properties are generating immediate interest and multiple offers.
Others are remaining available for several weeks and eventually reducing their prices.
Buyers are increasingly sensitive to homes that appear overpriced relative to nearby alternatives.
Sellers who begin too high may lose valuable early exposure before making an adjustment.
The first one to two weeks remain especially important. That is generally when a new listing receives its greatest visibility and when the most motivated buyers are likely to evaluate it.
The supplied June dataset does not break down sales, inventory, or absorption by price range. For that reason, conclusions about the performance of specific segments, including Pleasanton’s luxury market, cannot be reliably drawn from this report alone.
Market conditions can differ substantially between entry-level homes, move-up properties, and higher-priced or highly customized homes. Sellers and buyers should evaluate comparable activity within the property’s specific neighborhood and price category rather than relying exclusively on citywide averages.
Mortgage rates remained an important factor in June. Freddie Mac’s weekly survey placed the average 30-year fixed mortgage rate between 6.47% and 6.52% during most of the month. The rate was 6.43% on July 2, shortly after the reporting period ended.
Rates subsequently moved higher, reaching 6.55% on July 16. This illustrates how quickly financing conditions can change, even when rates remain within the mid-6% range. Freddie Mac PMMS archive
Mortgage rates do not move in direct lockstep with Federal Reserve decisions. They are influenced by inflation expectations, Treasury yields, economic growth, and financial-market expectations. However, the Federal Reserve did lower its target rate in September, October, and December 2025, which helped shape the broader interest-rate environment. Federal Reserve meeting information
For Pleasanton buyers, even modest rate changes can materially affect monthly payments because of the area’s home prices. Buyers should compare financing scenarios with a qualified lender instead of basing their plans on a single advertised rate.
The market remains capable of producing an excellent sale, but it is less forgiving of strategic mistakes.
Sellers should focus on four priorities:
Price accurately from the beginning. The number of reductions shows that aspirational pricing carries greater risk.
Prepare the home carefully. Buyers with more choices are more likely to notice deferred maintenance, dated finishes, or presentation problems.
Create a strong launch. Photography, digital marketing, staging, positioning, and initial exposure can influence whether a property generates early momentum.
Monitor the response immediately. Showing activity, online engagement, buyer comments, and competing inventory should be evaluated during the first days on the market.
The fact that 44.1% of sales closed above asking confirms that buyers will still compete. The 35% active-listing reduction rate confirms that they won’t compete indiscriminately.
June offered buyers more selection and somewhat greater negotiating leverage than the tight winter and early-spring markets.
Homes that have been available for several weeks may present opportunities, particularly if the seller has already adjusted the price or is approaching an important timing decision. Buyers may be able to negotiate on price, repairs, credits, closing dates, or other terms, depending on the property.
However, the strongest new listings can still move quickly and receive multiple offers. Buyers should be fully pre-approved, understand recent comparable sales, and decide in advance how aggressively they are prepared to compete.
More inventory does not mean every home is negotiable. It means buyers can be more selective while remaining prepared to act decisively when the right property appears.
Pleasanton’s market is moving toward greater balance, but it hasn’t become a buyer’s market across the board.
Inventory has returned, pending activity improved in June, and more than four out of every ten sales closed above asking. At the same time, longer market times and widespread price reductions show that buyers are applying greater scrutiny.
The key issue heading into the second half of 2026 will be whether buyer demand keeps pace with available inventory. If mortgage rates decline, additional buyers could enter the market and strengthen competition. If rates remain elevated and inventory continues to build, sellers may face more pressure to adjust expectations.
For now, the clearest description is a selective market: favorable to sellers who position their homes correctly and potentially advantageous for buyers who know how to identify and negotiate the right opportunity.
This update covers Pleasanton single-family homes and is based on information supplied in the June 2026 Pleasanton Market Pulse Report.
Primary sources:
TrendGraphix and MLS data
Fifteen-month market trend analysis covering April 2025 through June 2026
Freddie Mac Primary Mortgage Market Survey
Point-in-time market data and completed monthly totals
MLS information is deemed reliable but is not guaranteed. Figures may change as listings are updated or transactions are reported. Citywide statistics can also be influenced by the size, condition, location, and price range of the properties sold during a particular month.
Citywide statistics provide useful context, but your price range, neighborhood, property condition, and timing can produce a very different result.
If you’re considering selling, Doug Buenz and The 680 Group can prepare a property-specific pricing and positioning analysis based on your home and its current competition. If you’re buying, the team can help you identify which listings may offer negotiating room and which require a faster response.
There’s no pressure or obligation, just practical local guidance based on your goals and the current Pleasanton market.
Stay up to date on the latest real estate trends.
Market Update
Doug Buenz | October 16, 2026
Inventory has leveled off, buyer activity has slowed, and accurate pricing is becoming increasingly important.

Market Update
Doug Buenz | October 12, 2026
Inventory has leveled off, buyer activity has slowed, and strategic pricing continues to shape results.

Market Update
Doug Buenz | October 9, 2026
Well-priced homes are selling quickly, while longer market times give buyers more negotiating room.
Market Update
Doug Buenz | September 21, 2026
Inventory remains elevated, absorption stays below 40%, and Dublin buyers are separating well-positioned homes from listings that miss the market.
Market Update
Doug Buenz | September 19, 2026
Pricing Precision Shapes the Early Fall Market

Market Update
Doug Buenz | September 15, 2026
August 2026 single-family home data for Pleasanton, California, published September 2026

Doug Buenz | August 20, 2026
Dublin’s latest single-family home trends, including inventory, buyer demand, pricing, and days on market from July 15 through August 17, 2026.

Market Update
Doug Buenz | August 18, 2026
Pleasanton buyers have more choices, but well-priced homes can still sell at or above asking. Here’s what the latest single-family-home data means.

Market Update
Doug Buenz | August 18, 2026
South Livermore’s market is tight enough to reward decisive buyers, but recent closed sales show that sellers still need to price with discipline.