Dublin Real Estate Market Update: Pricing Still Matters in a Balanced Mid-Summer Market

DUBLIN REAL ESTATE
Dublin Real Estate Market Update: Pricing Still Matters in a Balanced Mid-Summer Market
Single-family home activity since July 15, 2026 | Prepared August 17, 2026
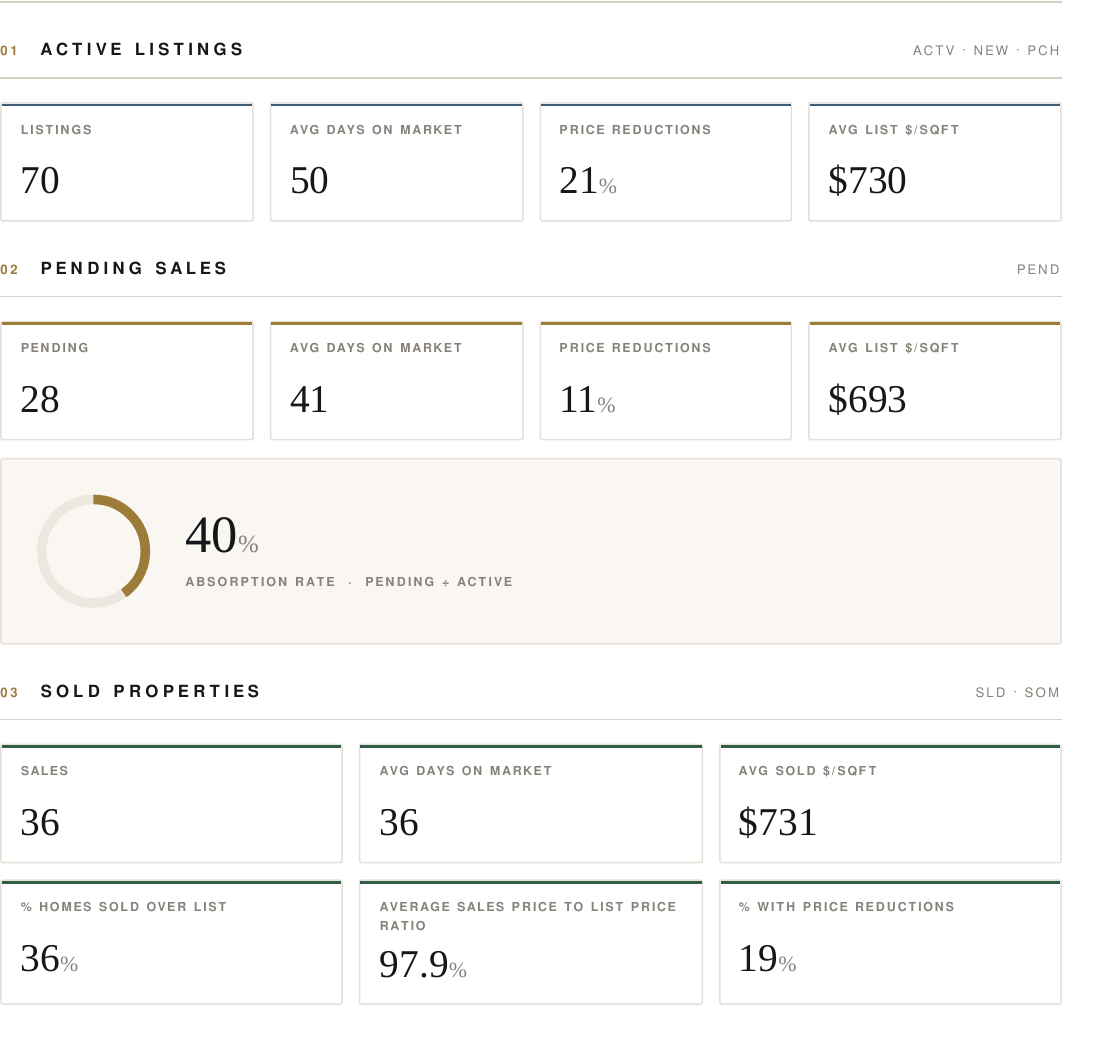
Dublin’s mid-summer single-family home market is neither overheated nor stalled. The latest MLS snapshot shows 70 active listings, 28 pending sales, and 36 closed sales since July 15. That creates a 40% pending-to-active absorption rate.
Homes are selling, but the strongest results are going to properties that enter the market at a price buyers recognize as reasonable.
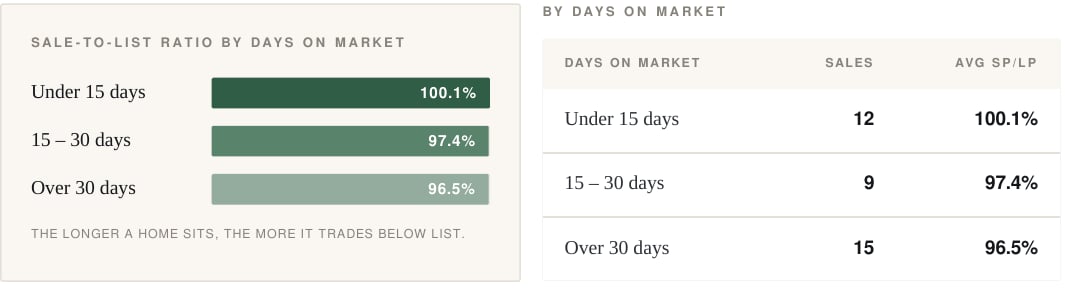
The clearest dividing line is time on market. Homes that sold in under 15 days averaged 100.1% of their original list price. Homes that took more than 30 days averaged 96.5%.
Dublin sellers still have an opportunity to achieve a strong result, but the data favors an accurate launch price over an aspirational one.
The latest Dublin single-family home market snapshot shows:
70 active listings
28 pending sales
36 closed sales
40% pending-to-active absorption rate
50 average days on market for active listings
41 average days on market for pending sales
36 average days on market for closed sales
$730 average list price per square foot
$731 average sold price per square foot
97.9% average sale-to-original-list-price ratio
36% of closed homes sold above their original list price
19% of closed sales had a price reduction
Seventy single-family homes were actively listed in Dublin, compared with 28 pending sales. The resulting 40% absorption rate points to meaningful buyer activity, but also enough available inventory for buyers to compare properties.
The report also identifies 22 contingent listings that are excluded from both the active and pending counts. This means the visible active inventory does not tell the entire story. Some properties have already attracted buyers but have not yet moved into pending status.
Nine active listings had been on the market for more than 90 days, while 11 had entered the market within the previous two weeks. Those two groups represent very different negotiating situations.
A recently listed property may still have a seller expecting immediate activity. A home that has been available for more than 90 days may have a seller who is more receptive to a serious offer or creative terms.
Dublin recorded 28 pending sales, with an average of 41 days on market.
Only 11% of the pending properties had undergone a price reduction, compared with 21% of the active inventory. This suggests that many homes securing buyers are doing so without first needing a visible price adjustment.
Average asking price among pending listings was $693 per square foot, compared with $730 per square foot for active listings. Differences in property size, age, condition, location, and price range may contribute to that gap, so the figures should not be interpreted as a direct measure of individual property values.
The broader message is that buyers remain active, but they are not responding equally to every listing.
The 36 closed sales averaged 97.9% of their original list price, and 36% sold above the seller’s original asking price.
The report lists a median sale price of $1,742,500 and median days on market of 22.
Average asking price among active listings was $730 per square foot, while closed sales averaged $731 per square foot. At the market-wide level, asking prices and recent sale prices were closely aligned.
That does not mean every home was priced correctly. It means Dublin sellers, as a group, were asking approximately what buyers were ultimately willing to pay.
Time on market had a measurable relationship with the final sale-to-list-price ratio:
Homes sold in under 15 days averaged 100.1% of original list price.
Homes sold in 15 to 30 days averaged 97.4%.
Homes sold after more than 30 days averaged 96.5%.
Only seven of the 36 closed properties had a price reduction before selling. Those homes averaged 93.0% of their original list price and spent an average of 62 days on the market.
The 29 homes that sold without a price reduction averaged 99.1% of original list price and 30 days on market.
The data does not prove that pricing alone caused the difference. Property condition, location, presentation, and price range also influence results. However, the pattern strongly reinforces the financial cost of missing the market at launch.
The market performed differently across Dublin’s various price ranges.
Every price range below $2.2 million averaged between 97% and 99.7% of original list price. Below $1.4 million, eight of the 13 closed sales finished above asking.
Above $2.2 million, none of the six closed sales exceeded original list price. Those higher-priced properties averaged 94.7% of original list price.
That split matters.
Entry-level and mid-range properties may still attract competition when positioned well. Higher-priced homes face more negotiation and need a pricing and presentation strategy calibrated to a smaller buyer pool.
The report also identifies 14 active listings built in 2025 or 2026, many concentrated on a limited number of streets. New-construction inventory can affect competition, particularly when builders offer financing incentives, upgrades, or closing-cost assistance.
Mortgage rates and monthly payments continue to influence buyer affordability, but the supplied MLS snapshot does not include financing data.
The Dublin market statistics should therefore be viewed as a measure of local listing and sales activity rather than a complete picture of buyer purchasing power.
For buyers, the relevant calculation is not simply the purchase price. Interest rate, down payment, property taxes, insurance, homeowners association expenses, and available seller or builder credits can all affect the monthly cost of ownership.
The market is rewarding precision.
A well-prepared home priced in line with recent buyer behavior can still sell quickly and, in some price ranges, above asking. The greatest risk is using a hopeful list price to test the market.
Once a home accumulates days on market or requires a reduction, buyers often expect additional leverage. Sellers may ultimately accept a lower price than they could have achieved with a more accurate launch strategy.
Before listing, sellers should evaluate:
The most recent comparable sales
Current competing listings
Property condition and presentation
Neighborhood and location
Demand within the home’s specific price range
The likely buyer profile
New-construction competition
The timing and positioning of the market launch
The objective is not to price low. It is to price where the market will respond strongly enough to protect negotiating leverage and final proceeds.
Buyers should separate the market into two general categories.
Fresh, well-priced homes below $1.4 million may require a decisive first offer because competition remains possible. Eight of the 13 homes sold in this range closed above asking.
Older listings, especially those on the market for more than 90 days, may present a different negotiation opportunity. Buyers should review the property’s pricing history, condition, previous activity, and the seller’s current motivation before determining an offer strategy.
At the upper end, leverage may appear through price, terms, credits, or builder incentives.
Builders may be more willing to provide rate buydowns, upgrades, or closing-cost assistance than to make a large reduction to the advertised purchase price. Buyers should compare the financial value of those incentives rather than focusing only on the headline price.
Dublin remains an active but price-sensitive real estate market.
The strongest properties can still generate urgency, while homes that miss the mark at launch are more likely to spend additional time on the market and eventually trade below asking.
Buyers have choices, but not every listing offers the same leverage. Sellers have opportunity, but the initial market response remains critical.
The best strategy on either side is property-specific. Citywide averages are useful for understanding direction, but pricing and negotiating decisions should be based on the home’s neighborhood, condition, competition, and price range.
Source: MLS market snapshot supplied by The 680 Group.
Activity covers Dublin single-family homes since July 15, 2026, and was prepared August 17, 2026.
OLP = original list price. LP = current list price. SP = sold price.
The active set includes ACTV, NEW, and PCH listings. CS listings are excluded. Sale-price ratios are computed against original list price and shown to one decimal place.
Data was compiled from MLS sources deemed reliable but has not been independently verified.
A citywide report is a useful starting point, but your home or target neighborhood may perform differently.
Contact me for a property-specific pricing analysis, competitive market review, or buying strategy based on current Dublin inventory.
Doug Buenz | The 680 Group
680homes.com | (925) 621-0680
CA DRE #00843458
The 680 Group is a team of real estate agents affiliated with Compass, a real estate broker licensed by the State of California, License #01527235, which abides by Equal Housing Opportunity laws. If your property is currently listed for sale, this is not a solicitation.
Stay up to date on the latest real estate trends.

South Livermore
Doug Buenz | October 22, 2026
Seven luxury homes are on the market in South Livermore, with no pending sales. Four closings show how time on market relates to sale-to-list results.
Tri-Valley real estate
Doug Buenz | October 21, 2026
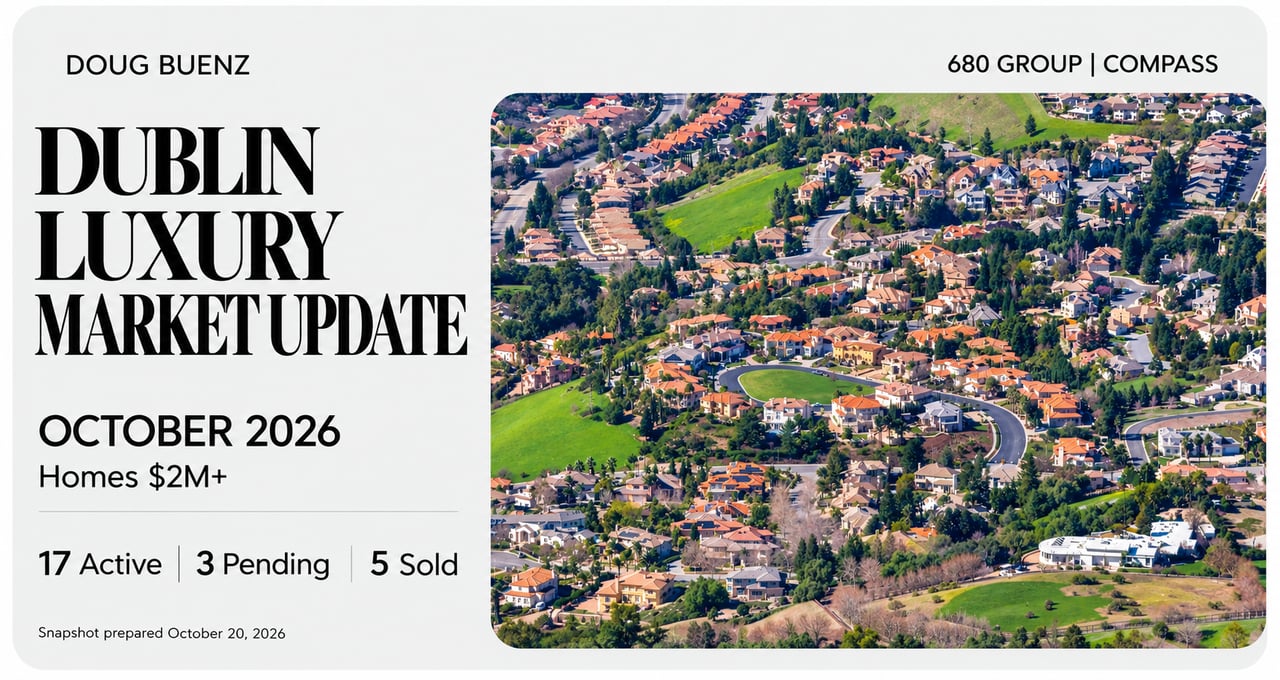
Seventeen active listings and five closings highlight the importance of property specific pricing
Market Update
Doug Buenz | October 16, 2026
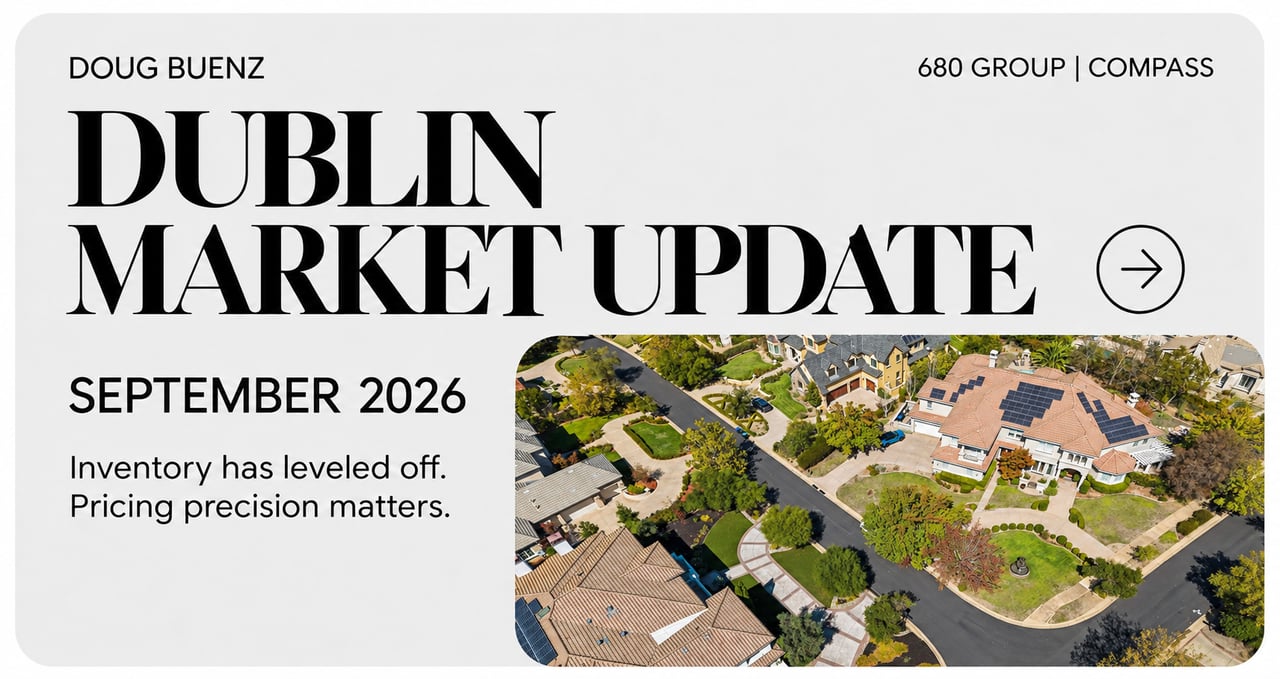
Inventory has leveled off, buyer activity has slowed, and accurate pricing is becoming increasingly important.

Market Update
Doug Buenz | October 12, 2026
Inventory has leveled off, buyer activity has slowed, and strategic pricing continues to shape results.

Market Update
Doug Buenz | October 9, 2026
Well-priced homes are selling quickly, while longer market times give buyers more negotiating room.
Market Update
Doug Buenz | September 21, 2026
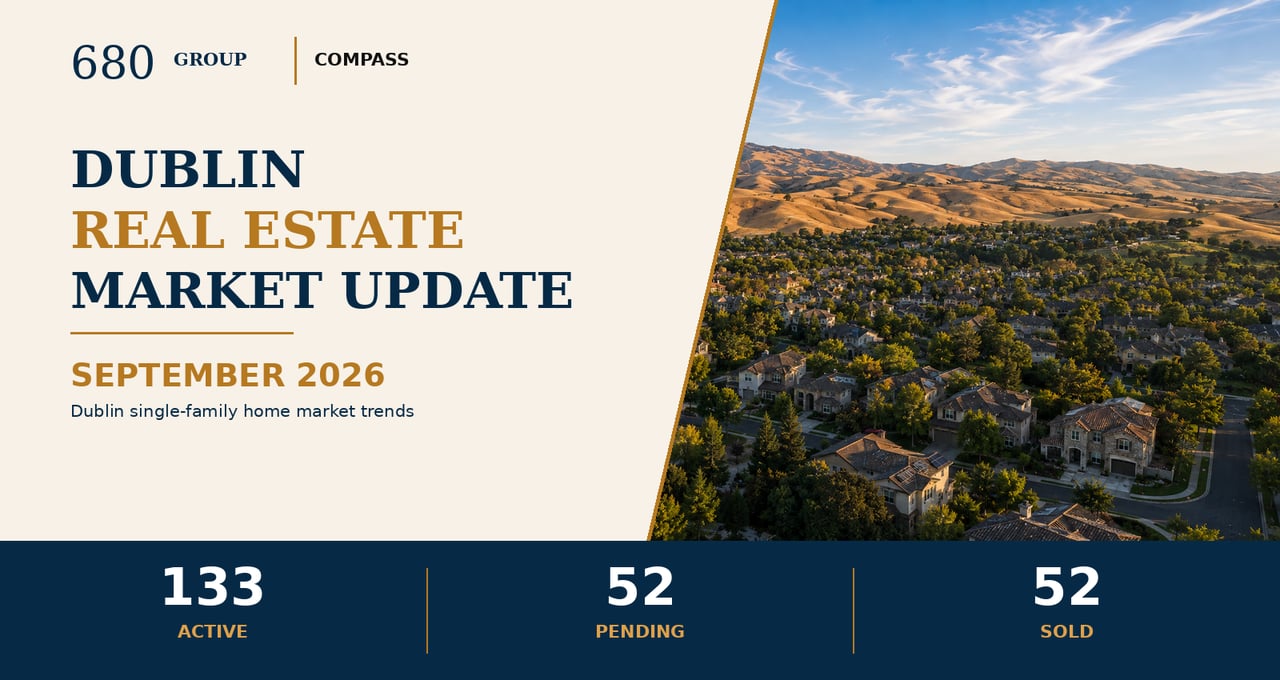
Inventory remains elevated, absorption stays below 40%, and Dublin buyers are separating well-positioned homes from listings that miss the market.

Market Update
Doug Buenz | September 19, 2026
Pricing Precision Shapes the Early Fall Market

Market Update
Doug Buenz | September 15, 2026
August 2026 single-family home data for Pleasanton, California, published September 2026
Doug Buenz | August 20, 2026
Dublin’s latest single-family home trends, including inventory, buyer demand, pricing, and days on market from July 15 through August 17, 2026.