Pleasanton Real Estate Market Update: August 2026
Market Update

Market Update
Pleasanton Real Estate Market Update: August 2026
July 2026 single-family home activity in Pleasanton, California
Pleasanton remains a market of two very different outcomes. Homes that are priced correctly, well prepared, and marketed effectively can still sell quickly and command strong terms. Homes that miss the market are accumulating days on market and giving buyers more negotiating leverage.
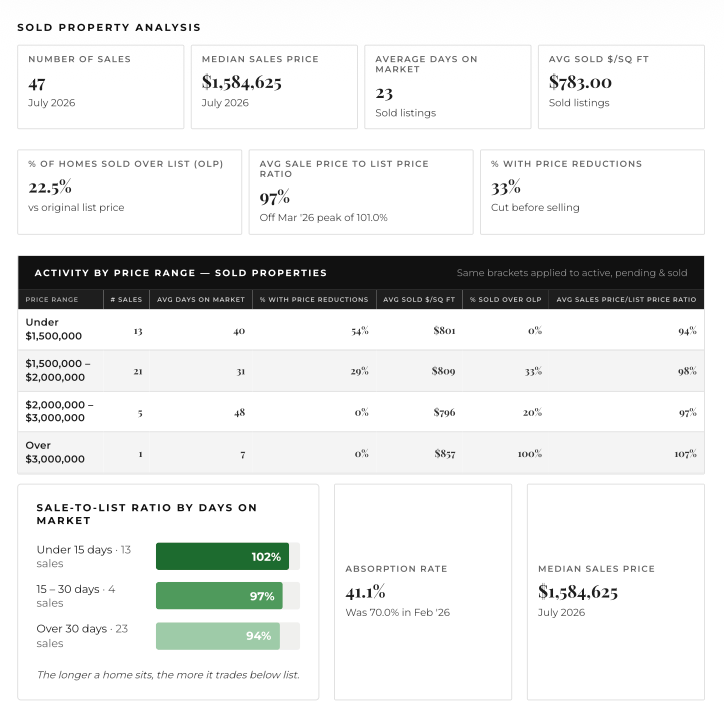
In July, homes that sold in fewer than 15 days averaged 102% of their original list price. Those that took more than 30 days averaged 94%. Price it right and it still moves. Price it wrong and the data is unforgiving.
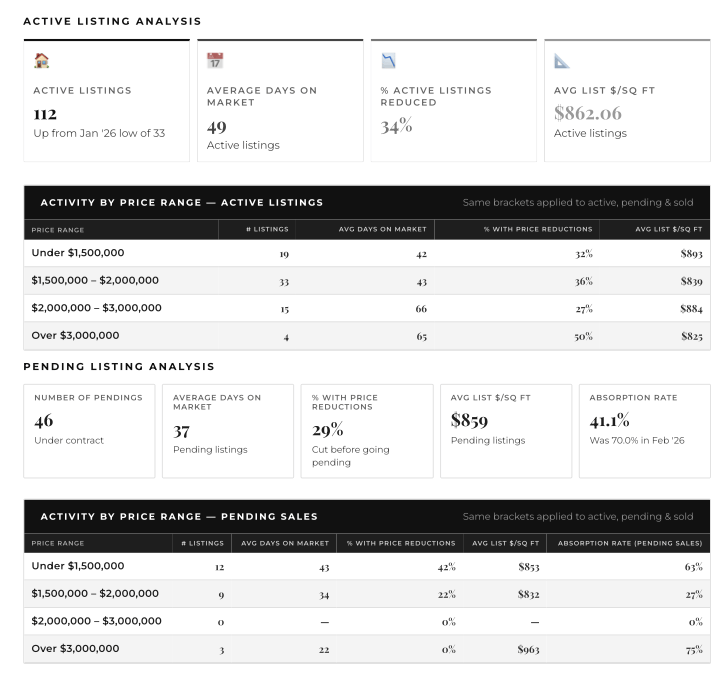
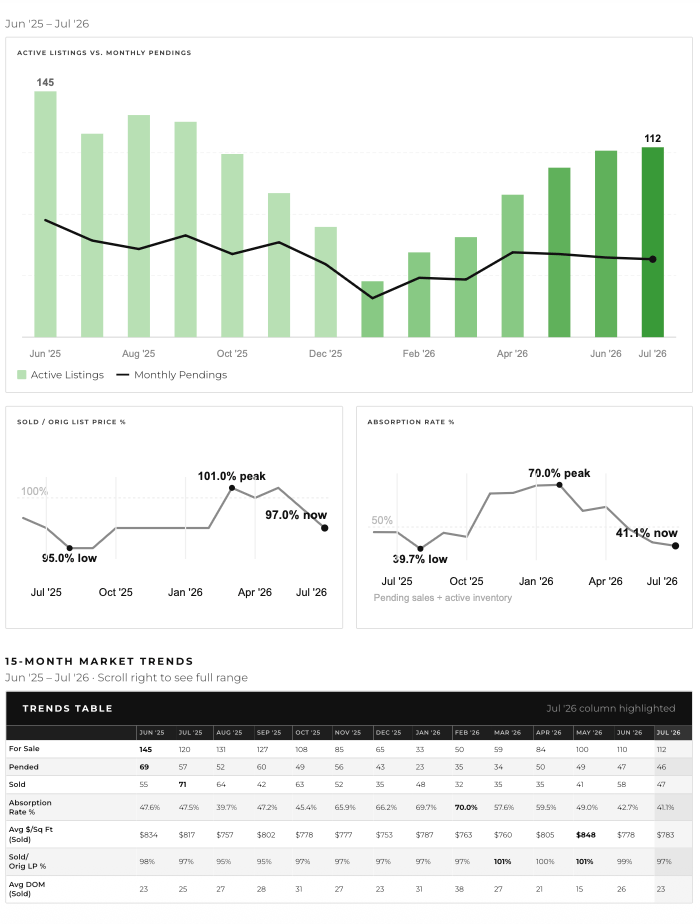
Pleasanton had 112 active single-family homes in July, up slightly from 110 in June and far above the January 2026 low of 33. The average active listing had been on the market for 49 days, and 34% had already taken a price reduction.
That gives buyers more selection, but it does not mean every home offers the same opportunity. The best-positioned listings can still attract immediate competition. Leverage is more likely to appear on homes with extended market time, prior price reductions, or a clear mismatch between price and condition.
There were 46 pending sales in July, compared with 47 in June. With 112 active listings, the reported absorption rate was 41.1%, down from 42.7% the month before and well below the 70.0% level reached in February.
This is a more measured market than it was earlier in the year. Buyers are active, but they are less willing to overlook an aggressive price, dated presentation, or a compromised location.
Pleasanton recorded 47 closed sales in July, down from 58 in June. The median sale price was $1,584,625, while the average sold price was $783 per square foot, slightly above June's $778.
The average sale-to-original-list-price ratio declined to 97%, and 22.5% of reported sales closed above their original asking price. At the same time, 33% of sold homes had reduced their price before selling.
The takeaway is not that Pleasanton home values are moving uniformly lower. It is that buyers are drawing a sharper line between homes that earn their asking price and those that do not.
Speed of sale remains one of the strongest indicators of pricing performance. The gap between 102% and 94% is substantial. Sellers who test the market too high risk losing the launch-period attention that often produces their best result.
The detailed July tables show meaningful differences by price point:
Under $1.5 million: 13 reported sales averaged 40 days on market and 94% of original list price. None sold above original list price, and 54% had a price reduction.
$1.5 million to $2 million: 21 reported sales averaged 31 days on market and 98% of original list price. One-third sold above original list price.
$2 million to $3 million: Five reported sales averaged 48 days on market and 97% of original list price.
Over $3 million: The table included only one sale, so its 107% result should not be treated as a market trend.
The $1.5 million to $2 million segment produced the largest number of reported sales in the price-range table. Above $2 million, the sample sizes were too small to support broad conclusions from one month alone.
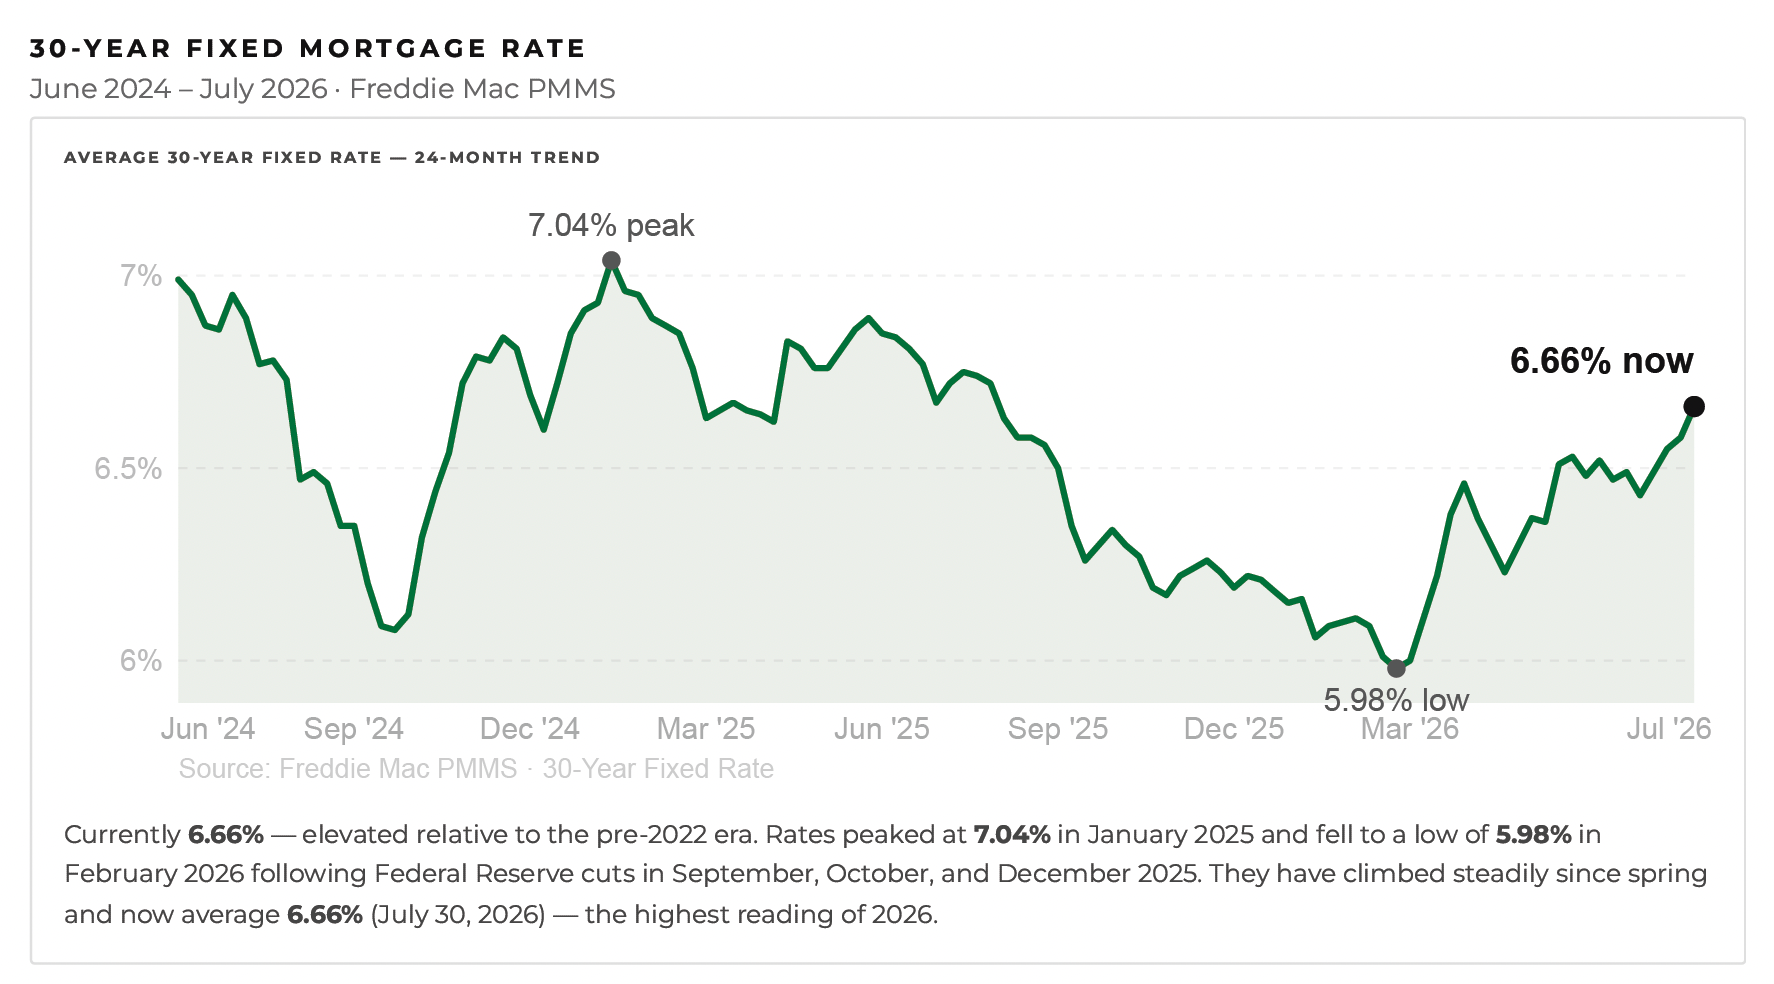
Freddie Mac's survey placed the average 30-year fixed mortgage rate at 6.66% on July 30, 2026, the highest reported reading of 2026 in the source data. That was above the February 2026 low of 5.98%, although still below the 7.04% peak recorded in January 2025.
At Pleasanton price points, even a modest rate change can materially affect purchasing power. Rates remain an important constraint on demand, particularly in the $1.5 million to $2.5 million range.
The market is still rewarding sellers who get the fundamentals right. That means pricing from current, relevant comparable sales, preparing the property to compete, and creating enough early exposure to reach the right buyers during the launch window.
The first two weeks matter. A strategy built around "trying a higher price" can become expensive when the alternative is joining the homes that sell after 30 days at an average of 94% of original list price.
Buyers have choices and negotiating opportunities, especially among homes with longer market times or prior reductions. Preparation still matters: secure financing, know the recent comparable sales, and be ready to act when the right home is priced well.
The strongest new listings may still sell quickly and above asking. The leverage is real, but it is concentrated rather than market-wide.
Pleasanton is not moving as one market. It is sorting listings by price, presentation, location, and seller motivation.
The number I am watching next is absorption. If demand remains near 40% while inventory stays above 100 homes, buyers should retain meaningful choice. If inventory contracts later in the season while pending activity holds, the balance could tighten again.
After more than 36 years selling real estate in Pleasanton, I have seen this pattern many times: the market does not punish every seller, but it becomes unforgiving when a listing starts too high and has to chase buyers later. Individual property strategy matters more than the citywide average.
This update covers Pleasanton single-family homes and reports July 2026 activity. Data is from TrendGraphix/MLS, with mortgage-rate context from the Freddie Mac Primary Mortgage Market Survey.
Active means listed for sale in the July snapshot.
Pending means under contract during the reporting period.
Sold means a closed sale reported for July 2026.
Absorption rate is calculated as pending sales divided by active listings: 46 / 112 = 41.1%.
Sale-to-list figures in this report compare the sale price with the original list price, not the final list price.
Monthly figures can be revised as MLS records are updated.
The source's detailed price-range and days-on-market tables account for fewer properties than the headline totals. Those subgroup figures are presented as reported and should be treated as subset analysis, not a complete distribution of all July activity.
Thinking about buying or selling a home in Pleasanton? Contact Doug Buenz and The 680 Group at Compass for a property-specific analysis of what these market conditions mean for you.
Doug Buenz
Founder & Team Leader, The 680 Group | Compass
(925) 621-0680 | [email protected]
CalDRE #00843458
Stay up to date on the latest real estate trends.
Market Update
Doug Buenz | September 15, 2026
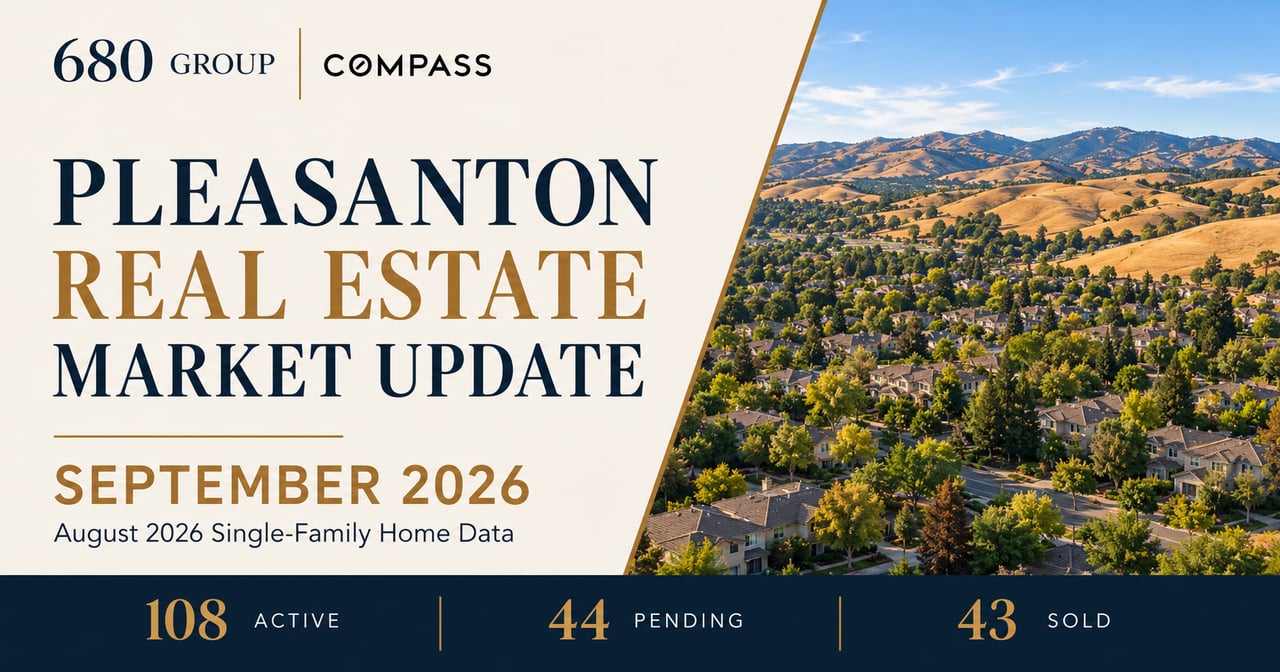
August 2026 single-family home data for Pleasanton, California, published September 2026

Doug Buenz | August 20, 2026
Dublin’s latest single-family home trends, including inventory, buyer demand, pricing, and days on market from July 15 through August 17, 2026.

Market Update
Doug Buenz | August 18, 2026
Pleasanton buyers have more choices, but well-priced homes can still sell at or above asking. Here’s what the latest single-family-home data means.

Market Update
Doug Buenz | August 18, 2026
South Livermore’s market is tight enough to reward decisive buyers, but recent closed sales show that sellers still need to price with discipline.
Market Update
Doug Buenz | August 7, 2026
August 2026 Update: Well-positioned homes sold quickly and averaged 102% of asking, while homes taking over 30 days averaged just 94%.

Pleasanton Real Estate
Doug Buenz | July 28, 2026
The most common reasons Pleasanton homes fail to attract offers—and what sellers should consider before relisting.

Market Update
Doug Buenz | July 21, 2026
More Inventory, Selective Buyers, and Uneven Results for Sellers

Market Trends
Doug Buenz | July 21, 2026
Single-family home activity included in the MLS snapshot from June 15 through July 20, 2026

Pleasanton Neighborhoods
Doug Buenz | July 10, 2026
Compare Pleasanton's most popular neighborhoods by home prices, architectural styles, commute access, parks, recreation, and local amenities to find the community that… Read more