Pleasanton Real Estate Market Update: Mid-July 2026
Market Trends

Market Trends
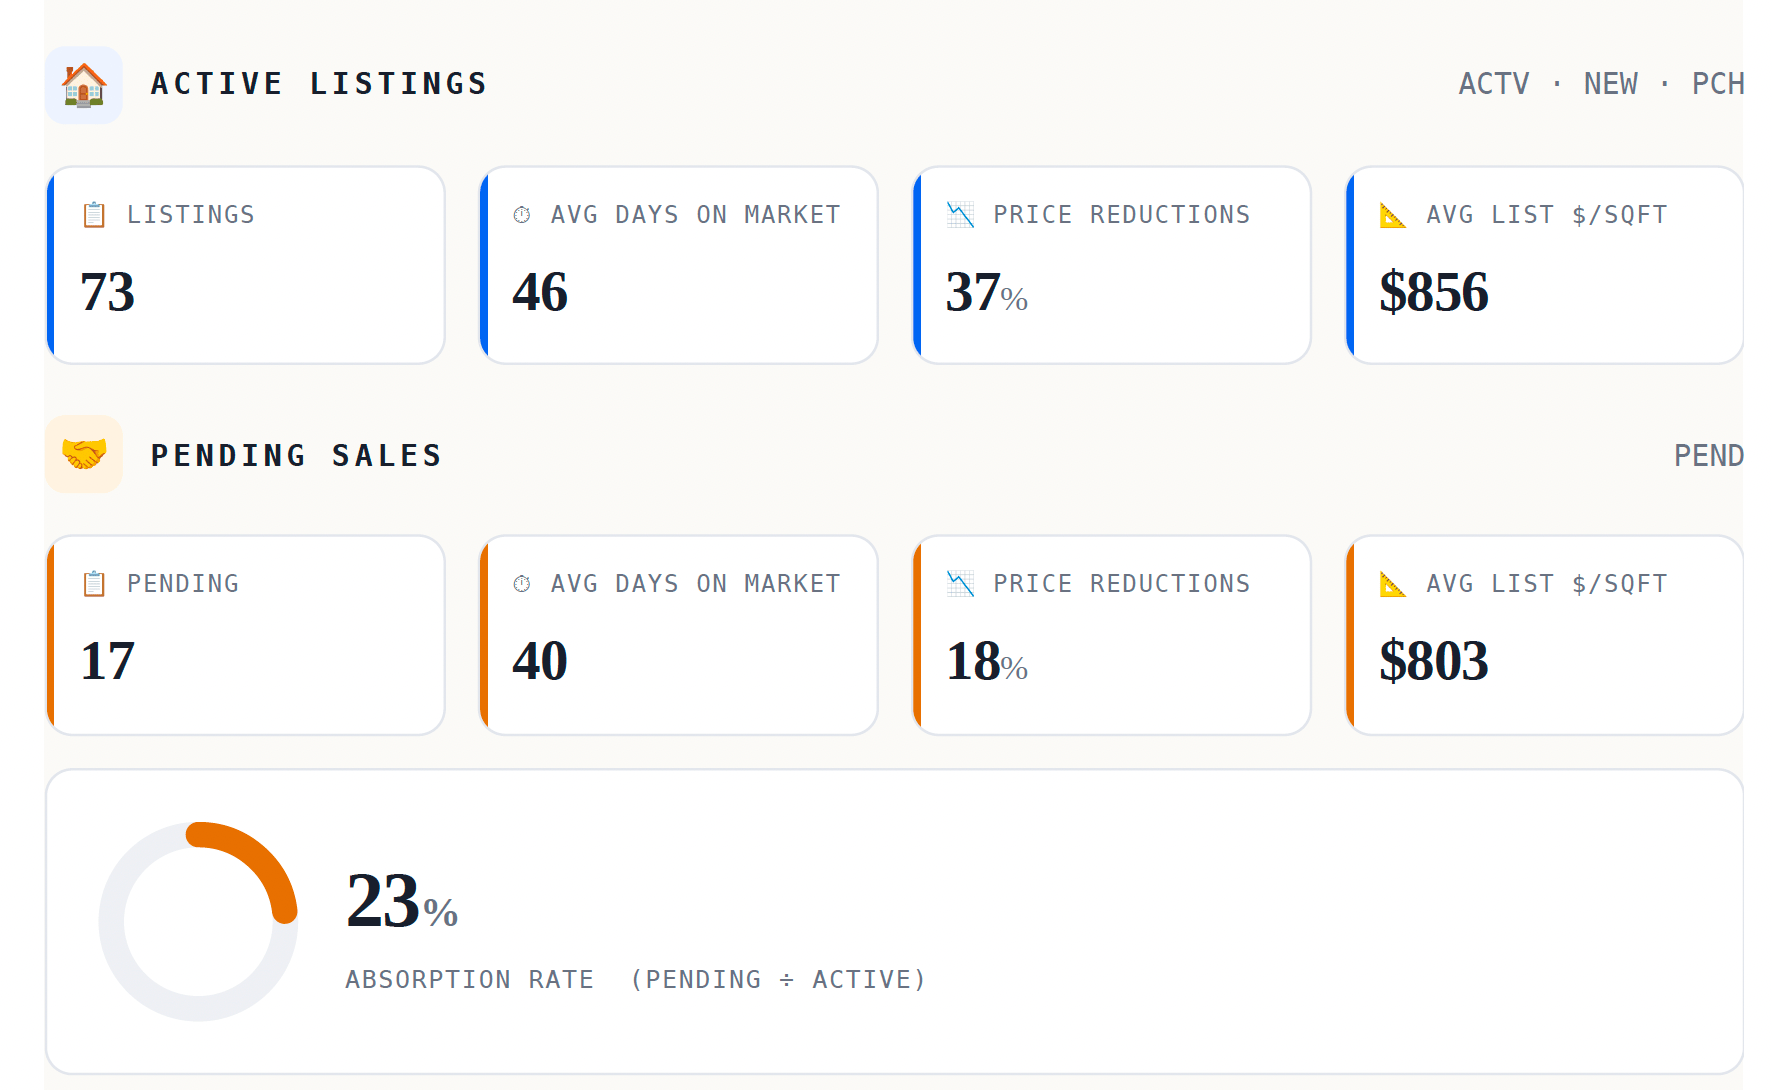
The Pleasanton real estate market is giving buyers more choices, but the best-positioned homes can still generate strong competition. As of July 20, the market snapshot included 73 active single-family homes and 17 pending sales. Using the report’s calculation of pending listings divided by active listings, that represents a 23% pending-to-active ratio. Thirty-seven percent of active listings had already received at least one price reduction, and active homes had been on the market for an average of 46 days.
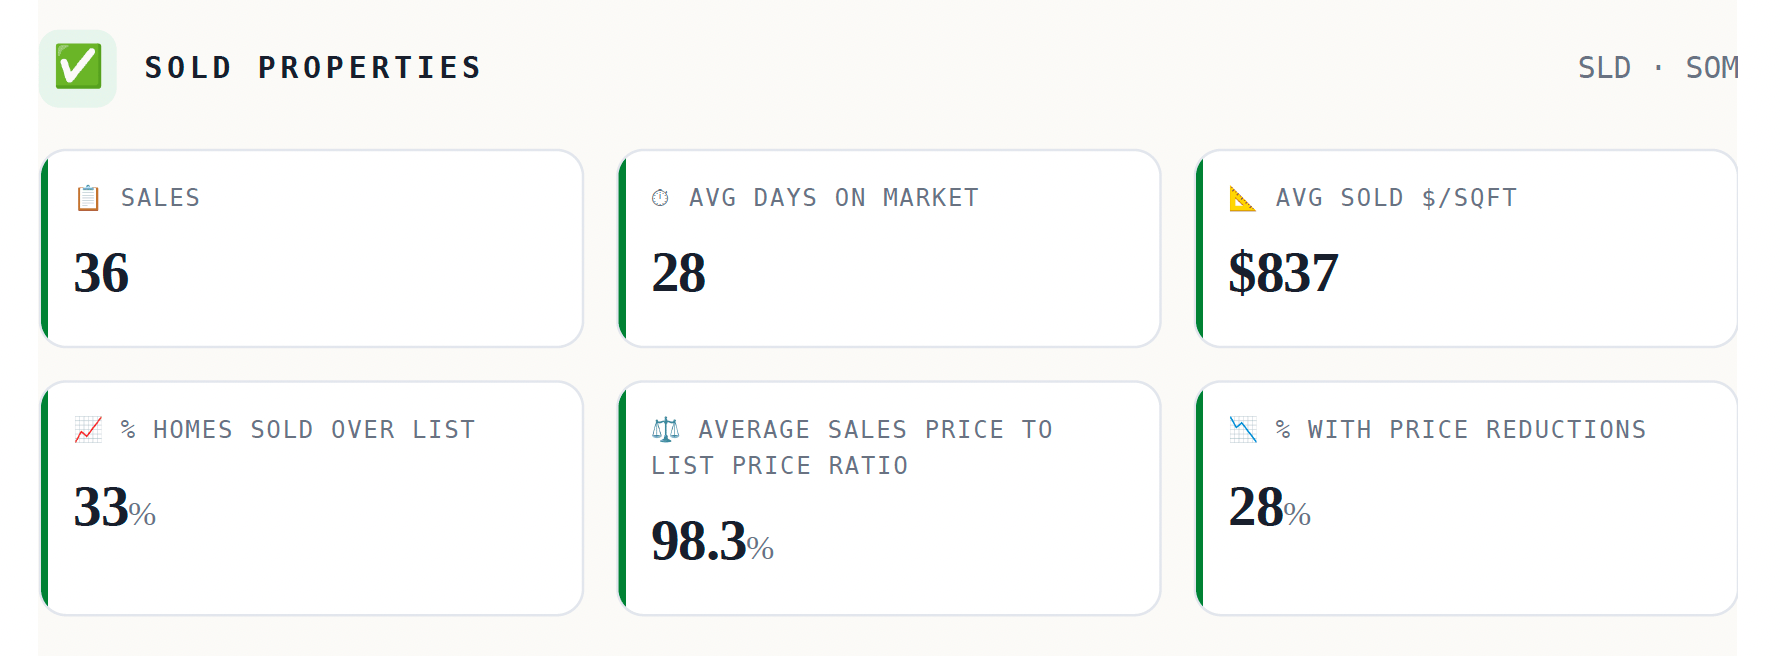
At the same time, one-third of the 36 closed sales sold above their final list price. The homes selling in fewer than 15 days averaged 102.4% of their final list price, demonstrating that buyers will still compete for homes that are priced, presented, and positioned effectively. This isn’t a distressed market. It is a more selective market that rewards sellers who respond to current conditions and buyers who understand the difference between an attractive opportunity and a home that is simply overpriced.
Pleasanton had 73 active single-family listings represented in the July 20 snapshot. These homes had been on the market for an average of 46 days, and 37% had already undergone at least one price reduction. That combination indicates that buyers have more opportunities to compare homes and that a meaningful portion of sellers are adjusting to current market conditions. However, the report doesn’t provide comparable inventory figures from earlier months, so it cannot independently establish how much inventory has increased or decreased over time.
The active-listing total shouldn’t be described as 73 homes newly listed since June 15. It represents the active inventory included in the snapshot as of July 20. For sellers, greater selection means a home must compete on price, presentation, condition, and perceived value. For buyers, it means there may be more time to evaluate certain listings, particularly those that have remained available for several weeks.
The report included 17 pending single-family sales. Compared with 73 active listings, that produces the report’s 23% pending-to-active ratio. This is best understood as a current measure of the relationship between pending and active inventory rather than a traditional months-of-inventory calculation. It suggests that buyer demand isn’t keeping pace with the total number of homes currently available. Pending properties had been on the market for an average of 40 days. Eighteen percent had undergone a price reduction, and their average current list price was $803 per square foot.
The lower price-per-square-foot figure for pending homes doesn’t necessarily mean buyers are receiving a uniform discount. Property size, condition, location, lot characteristics, and price range can all affect this measurement. Still, the difference between active and pending pricing supports the broader conclusion that buyers are responding selectively to value.
The 36 closed sales averaged $837 per square foot and sold for an average of 98.3% of their final list price. One-third of the sold homes closed above their final list price. That is an important counterpoint to the increase in price reductions: Pleasanton isn’t a market where buyers can assume every seller will accept a discounted offer.
Instead, two distinct patterns are emerging:
• Fresh, well-positioned listings can still attract competition and sell above list price.
• Listings that begin above what buyers consider reasonable may experience longer market times and eventual price reductions.
The $856 average asking price per square foot among active listings is $19 higher than the $837 average for closed sales. This comparison suggests a gap between current seller expectations and recent closed-sale results, but it shouldn’t be treated as an exact measure of overpricing because the groups may contain different types and sizes of homes.
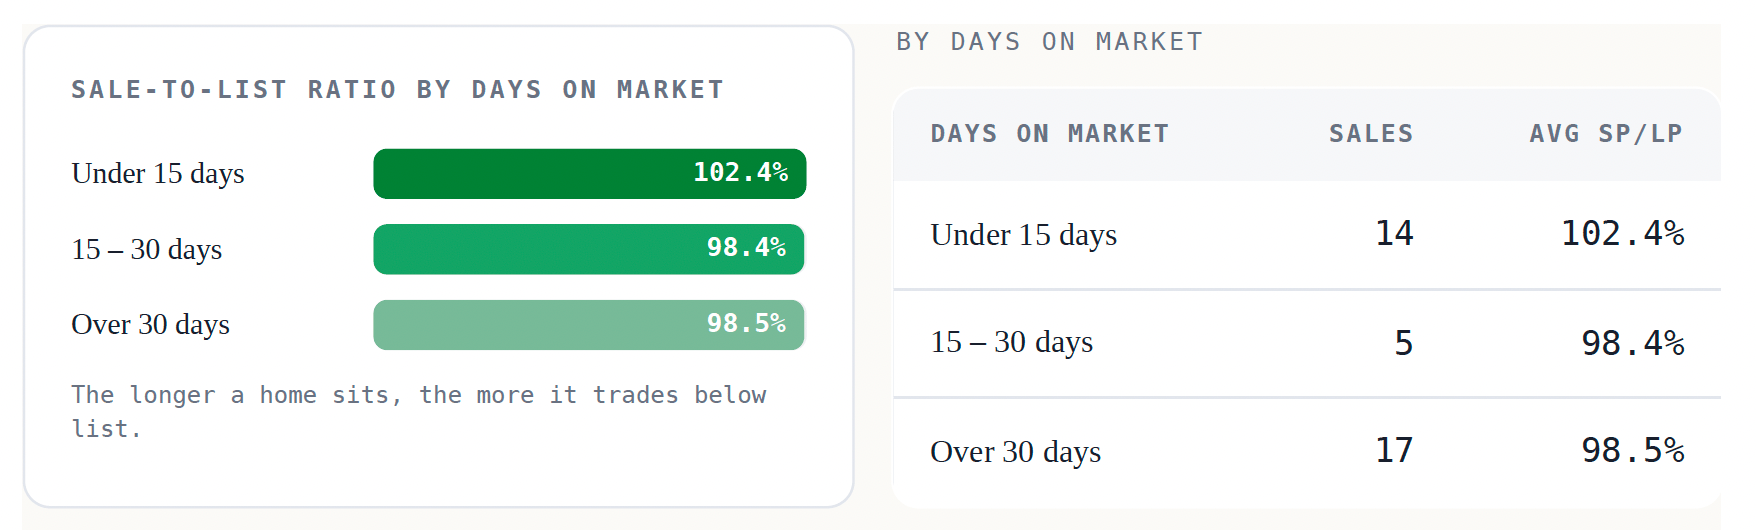
The strongest result in the report involved homes that sold within the first 15 days.
Fewer than 15 days: 14 sales averaging 102.4% of final list price
15–30 days: 5 sales averaging 98.4% of final list price
More than 30 days: 17 sales averaging 98.5% of final list price
Homes selling in fewer than 15 days averaged 102.4% of their final list price. Once market time exceeded 15 days, the average fell below final list price. Market time alone doesn’t necessarily cause a lower sale-to-list ratio. Homes selling quickly may also have more desirable locations, better presentation, stronger condition, or more accurate initial pricing. Nevertheless, the data reinforces the importance of the initial launch period.
A new listing typically receives its greatest concentration of attention during its first couple of weeks. Buyers who have been monitoring Pleasanton see the home at roughly the same time, creating the best opportunity for urgency and competition. Twenty-eight percent of the sold homes required a price reduction before selling. Among current active listings, that figure rises to 37%. Starting too high can mean missing the initial wave of demand and later reducing the price to reengage buyers.
The supplied mid-July report doesn’t separate activity by price range. As a result, it would be inaccurate to identify which Pleasanton price segments are moving fastest or experiencing the most price reductions. This distinction matters because entry-level, move-up, and luxury homes can behave differently within the same market. Price-range performance will be included in the end-of-month update if sufficient segmented data is available.
Mortgage rates remain an important constraint on buyer purchasing power. According to Freddie Mac, the average national rate for a 30-year fixed mortgage was 6.55% as of July 16, 2026. That was up from 6.49% one week earlier but below the 6.75% average recorded one year earlier. The average 15-year fixed rate was 5.93%.
These are national averages for conventional conforming loans and don’t represent the rate every Pleasanton buyer will receive. Actual rates depend on credit, down payment, loan amount, occupancy, points, lender pricing, and whether the loan is conforming or jumbo.
Rates in the mid-6% range continue to affect affordability, particularly at Pleasanton price points. This may be contributing to longer market times and more selective buyer behavior. At the same time, a modest year-over-year improvement in rates and greater housing selection may create better conditions for prepared buyers than headline rates alone suggest.
The opening weeks of a listing matter. The homes selling in fewer than 15 days averaged 102.4% of their final list price, while homes taking longer averaged below final list price. That doesn’t guarantee that every properly priced home will sell immediately, but it highlights the value of an effective initial launch.
Sellers should focus on:
• Pricing against current competing listings and recent sales
• Preparing the home before it reaches the market
• Creating a strong first impression online and in person
• Monitoring showing activity and buyer feedback immediately
• Responding quickly if the market rejects the original positioning
• Evaluating the likely net result of waiting versus adjusting
Pricing above the market with the intention of leaving room to negotiate can be risky when buyers have 73 active listings from which to choose. A home that appears overpriced may be excluded before a buyer ever schedules a showing.
Strategic pricing doesn’t mean underpricing every property. It means choosing a position that reflects the home’s condition, location, competition, and current buyer behavior.
Buyers currently have more negotiating room on certain homes, especially listings that have been available for several weeks or have already undergone a price reduction. Thirty-seven percent of active listings have reduced their price, and active homes have been on the market for an average of 46 days. Those numbers create opportunities to investigate:
• Why the home hasn’t sold
• Whether the current price reflects recent comparable sales
• How much competition exists
• Whether the seller’s timing creates negotiating flexibility
• Which terms may matter in addition to price
However, buyers shouldn’t assume that every Pleasanton listing will sell below asking. One-third of the closed sales sold above final list price, and homes selling in fewer than 15 days averaged 102.4%. If a well-priced home becomes available in a preferred location, buyers should be prepared to act decisively. For a property that has accumulated market time, a more patient and analytical negotiating strategy may be appropriate.
Pleasanton has moved into a more selective phase of the market. Buyers have more options, and sellers can’t rely on limited inventory alone to generate urgency. At the same time, demand hasn’t disappeared. The fact that one-third of recent sales closed above final list price shows that buyers will still compete when a property represents compelling value.
For sellers, the most important decisions are being made before the home reaches the market: preparation, presentation, pricing, and launch strategy. The market is less forgiving of an overly ambitious starting price, especially when buyers can compare the home with dozens of alternatives.
For buyers, this is a market that rewards preparation and judgment. Some homes offer legitimate negotiating opportunities. Others will sell quickly because the price and property align with buyer expectations. The bottom line is straightforward: price accurately, prepare thoughtfully, and respond to what the market is telling you.
This update is based on the Pleasanton Mid-July Market Snapshot, prepared July 20, 2026. The report covers Pleasanton single-family properties represented as active, pending, or sold in the MLS snapshot associated with activity since June 15.
The active category includes listings identified as ACTV, NEW, or PCH. Coming-soon listings were excluded. The report defines its 23% absorption rate as pending listings divided by active listings. Price-per-square-foot figures and market-time figures are averages, not medians. Average statistics can be influenced by the size, condition, location, and price distribution of the properties included.
The sale-to-list figures compare sale price with the final list price. They shouldn’t be interpreted as sale price compared with the original list price unless separately identified. Mortgage-rate information comes from the Freddie Mac Primary Mortgage Market Survey for the week ending July 16, 2026. All market statistics represent a limited period and can change as listings are added, withdrawn, placed under contract, or closed. Individual neighborhoods and price ranges may perform differently from the citywide averages.
Search Pleasanton homes for sale
Explore Pleasanton neighborhoods
Read the Complete Guide to Pleasanton Neighborhoods
Compare Pleasanton neighborhoods
View the June 2026 Pleasanton housing market report
Explore Pleasanton real estate resources
Citywide statistics provide useful context, but your price range, neighborhood, property condition, and timing can produce a very different result.
If you’re considering selling, Doug Buenz and The 680 Group can prepare a property-specific pricing and positioning analysis based on your home and its current competition. If you’re buying, the team can help you identify which listings may offer negotiating room and which require a faster response.
There’s no pressure or obligation, just practical local guidance based on your goals and the current Pleasanton market.
Stay up to date on the latest real estate trends.
Tri-Valley real estate
Doug Buenz | October 21, 2026
Seventeen active listings and five closings highlight the importance of property specific pricing
Market Update
Doug Buenz | October 16, 2026
Inventory has leveled off, buyer activity has slowed, and accurate pricing is becoming increasingly important.
Market Update
Doug Buenz | October 12, 2026
Inventory has leveled off, buyer activity has slowed, and strategic pricing continues to shape results.

Market Update
Doug Buenz | October 9, 2026
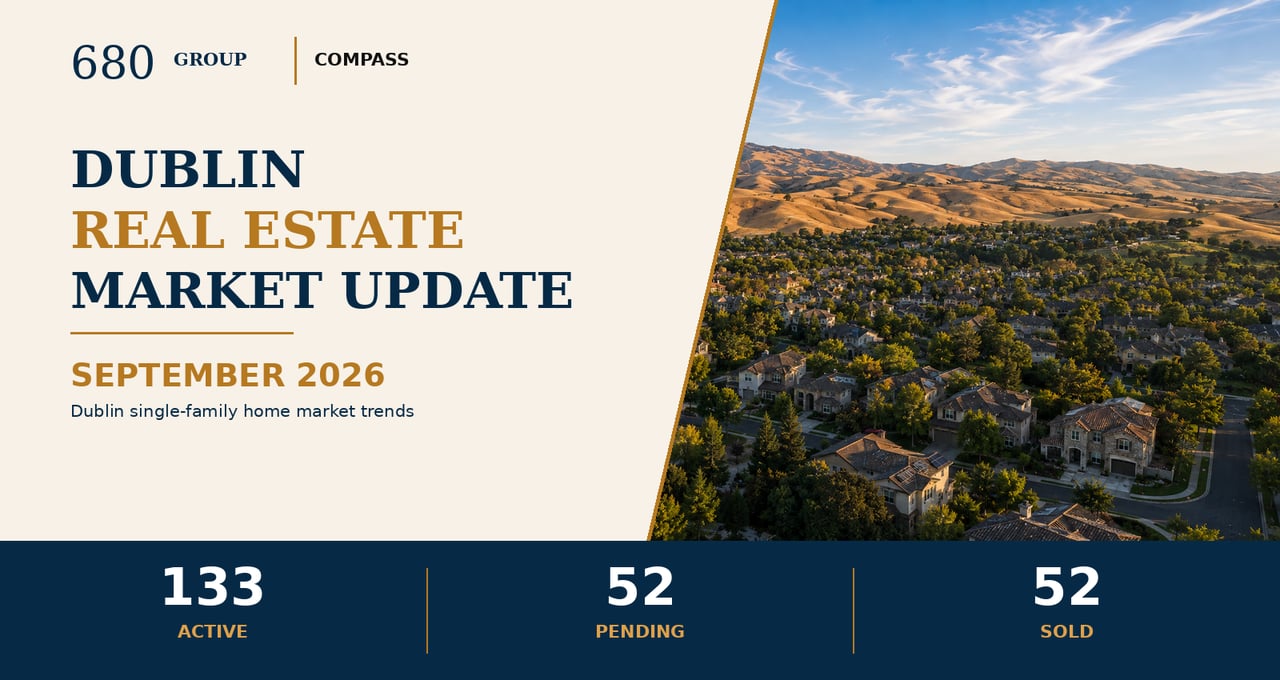
Well-priced homes are selling quickly, while longer market times give buyers more negotiating room.
Market Update
Doug Buenz | September 21, 2026
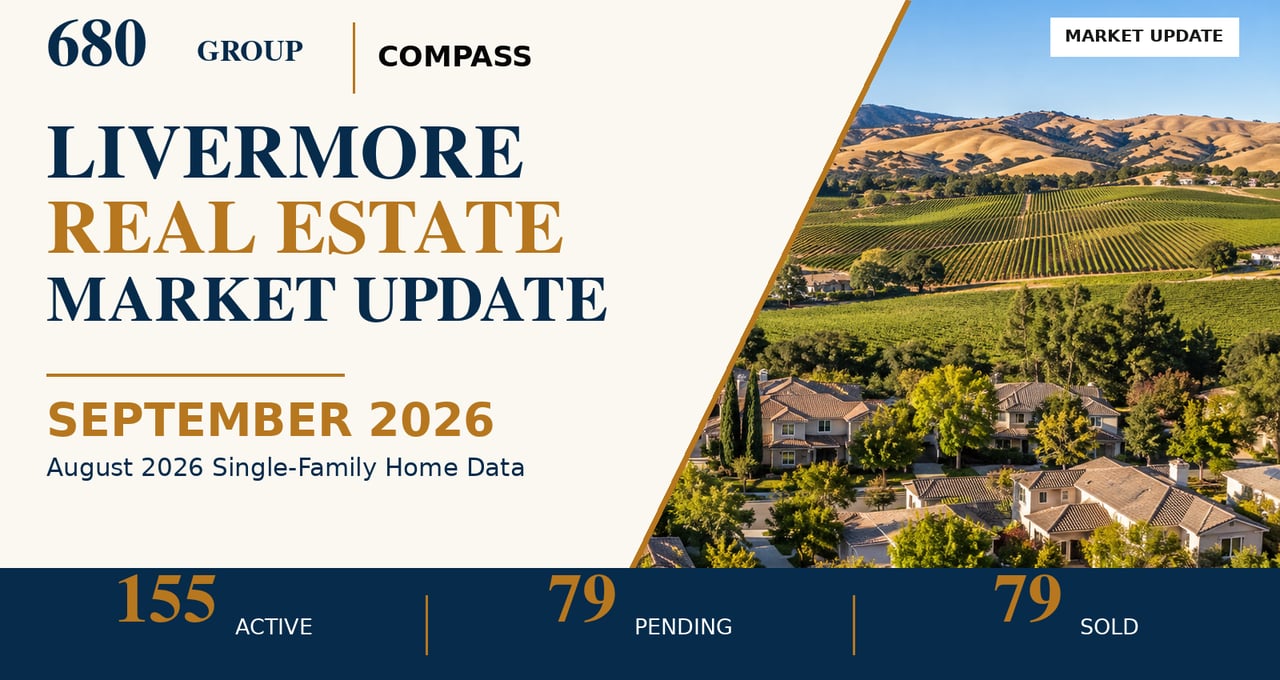
Inventory remains elevated, absorption stays below 40%, and Dublin buyers are separating well-positioned homes from listings that miss the market.
Market Update
Doug Buenz | September 19, 2026
Pricing Precision Shapes the Early Fall Market
Market Update
Doug Buenz | September 15, 2026
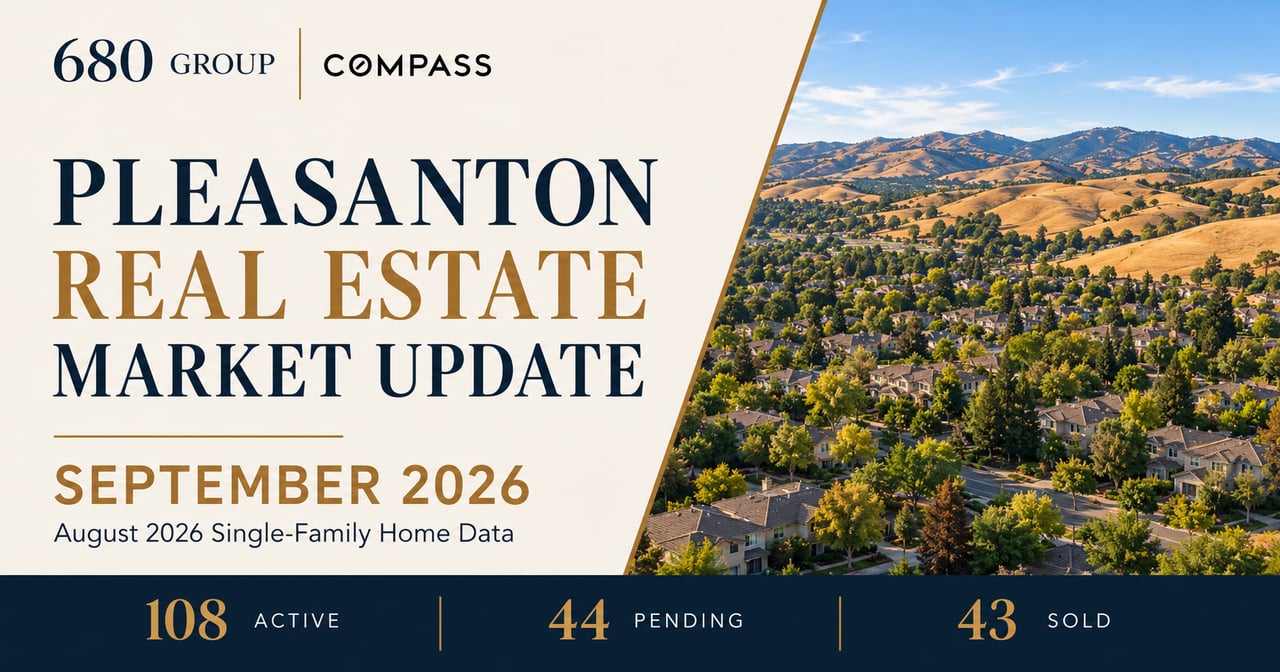
August 2026 single-family home data for Pleasanton, California, published September 2026

Doug Buenz | August 20, 2026
Dublin’s latest single-family home trends, including inventory, buyer demand, pricing, and days on market from July 15 through August 17, 2026.

Market Update
Doug Buenz | August 18, 2026
Pleasanton buyers have more choices, but well-priced homes can still sell at or above asking. Here’s what the latest single-family-home data means.