South Livermore Real Estate Market Update | August 2026
Market Update

Market Update
SOUTH LIVERMORE REAL ESTATE
South Livermore Market Update: Limited Inventory, but Buyers Still Have Leverage
Single-family home activity from July 15 through August 17, 2026
A market that is competitive—and negotiable.
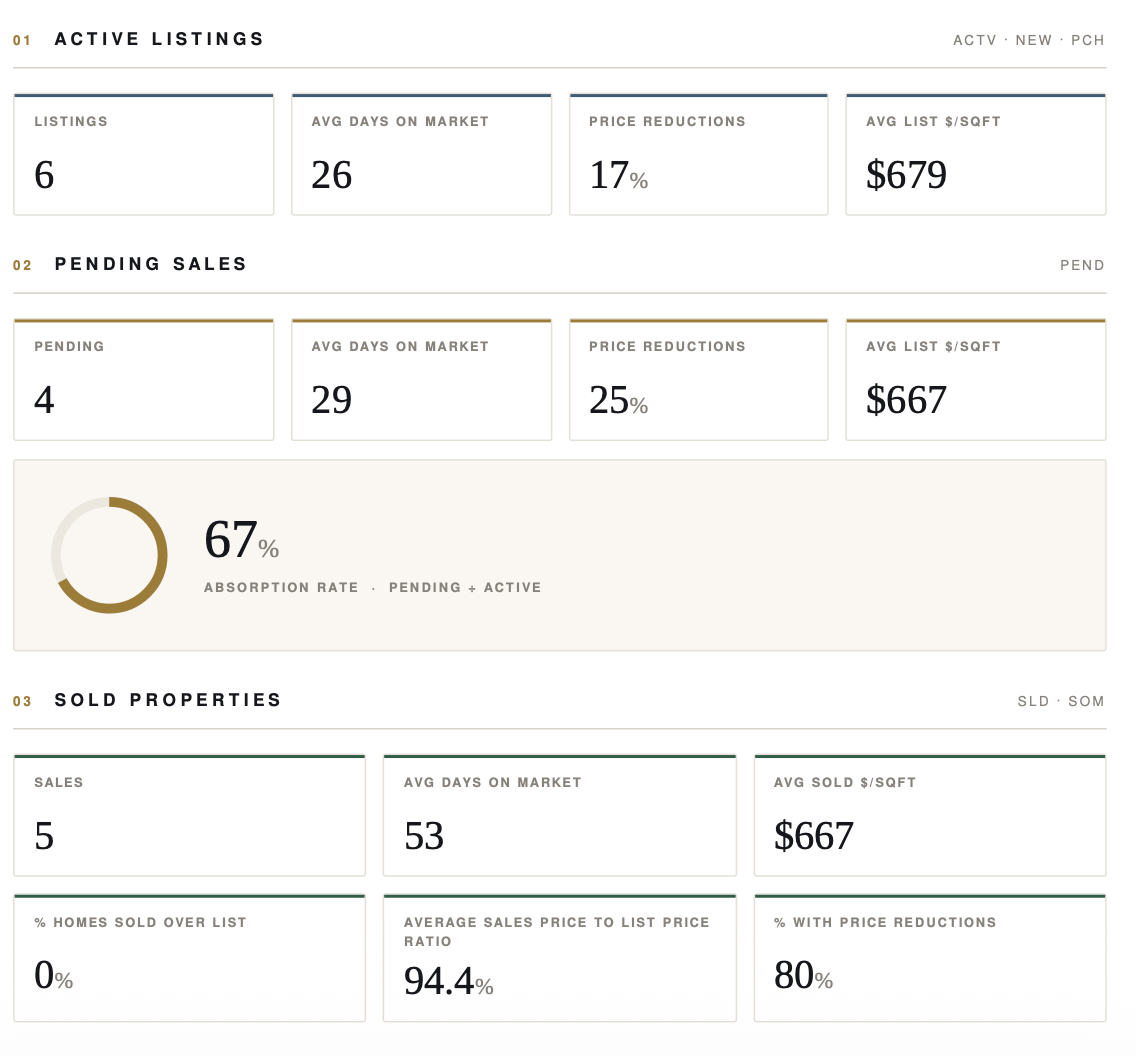
South Livermore’s single-family home market is sending two messages at once. Inventory is limited, with only six active listings, while four homes are already pending. That produces a 67% pending-to-active absorption rate—a strong sign that buyers are engaging with the available supply.
But the closed-sale data tells a more nuanced pricing story. Five homes sold during the reporting period, averaging 53 days on market and $667 per square foot. None sold above its original asking price. Collectively, the sales closed at 94.4% of original list price, and four of the five properties had a price reduction before selling.
The takeaway is straightforward: South Livermore is not a soft market, but it is a price-sensitive one. Desirable homes can attract buyers, yet aspirational pricing is still being corrected by the market.
What South Livermore sellers should know
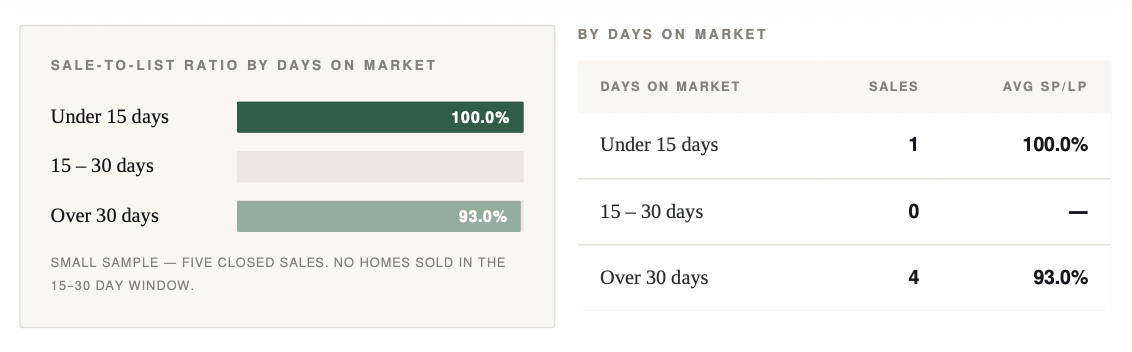
For sellers, the clearest signal is the relationship between time on market and the final price. The one sale that closed in fewer than 15 days achieved 100% of its original asking price. The four homes that remained on the market for more than 30 days averaged just 93.0% of original list price.
That does not prove that every well-priced home will sell immediately, especially with only five sales in the sample. It does show the cost of missing the market early. Once a listing accumulates days on market, buyers often gain confidence that the seller may negotiate, and the property can lose the urgency that drives stronger offers.
One property on Bresso Court began at $2,195,000, reduced to $2,099,000, and ultimately closed at $2,000,000 after 138 days. Another on Bertolli was originally offered at $2,699,999 and sold for $2,470,000—a difference of nearly $230,000. These were not simply negotiation outcomes; they were reminders that the market will eventually reconcile an ambitious starting price.
For a South Livermore seller, the highest-impact strategy is to price from current buyer behavior, not from a hoped-for negotiating cushion. A compelling launch price, polished presentation, and concentrated first-week marketing plan can protect both leverage and momentum.
What South Livermore buyers should know
Buyers should not interpret below-list sales as evidence that they can wait indefinitely. With six active listings and four pending sales, the selection of newer and larger South Livermore homes is still constrained. The right property may attract a buyer before it has time to become stale.
The better approach is to separate the house from the price. Move decisively when a home fits your location, floor plan, condition, and lifestyle priorities. Then use the closed-sale evidence to negotiate the number and terms with discipline.
Current active listings average $679 per square foot, compared with $667 per square foot for recent closed sales. That gap is not enormous, but the broader sale-to-list data shows room for negotiation—particularly when a home has been on the market for more than 30 days, has already reduced its price, or needs improvements.
In short, buyers may have leverage, but they do not have unlimited choice. Strong representation matters most when it helps you recognize the right opportunity quickly and negotiate it using property-specific evidence rather than a generic discount strategy.
The Bottom Line
South Livermore remains an active, selective market. The 67% pending-to-active ratio shows meaningful demand, while the 94.4% average sale-to-original-list-price ratio shows that buyers are resisting overpricing. Sellers should treat the first few weeks as their best opportunity to establish value. Buyers should be prepared to act on the right home, while using days on market, price reductions, comparable sales, and property condition to support their offer.
Because this update includes only five closed sales, the figures should be viewed as a directional snapshot rather than a definitive long-term trend. Individual outcomes can vary substantially by neighborhood, lot, condition, upgrades, floor plan, and presentation.
Thinking about buying or selling in South Livermore?
Local market averages are useful, but the value of a specific home depends on details that do not appear in a headline statistic. For a property-specific pricing analysis or a strategy conversation, contact Doug Buenz and the 680 Doug Buenz Group at (925) 621-0680 or visit 680homes.com.
Data note: Based on MLS activity for South Livermore single-family homes from July 15 through August 17, 2026. Active set includes ACTV, NEW, and PCH; coming-soon listings are excluded. Sale-price ratios are measured against original list price. MLS data is deemed reliable but has not been verified.
Brokerage disclosure: The 680 Group is a team of real estate agents affiliated with Compass, a real estate broker licensed by the State of California (License #01527235), which abides by Equal Housing Opportunity laws. If your property is currently listed for sale, this is not a solicitation.
Stay up to date on the latest real estate trends.
Tri-Valley real estate
Doug Buenz | October 21, 2026
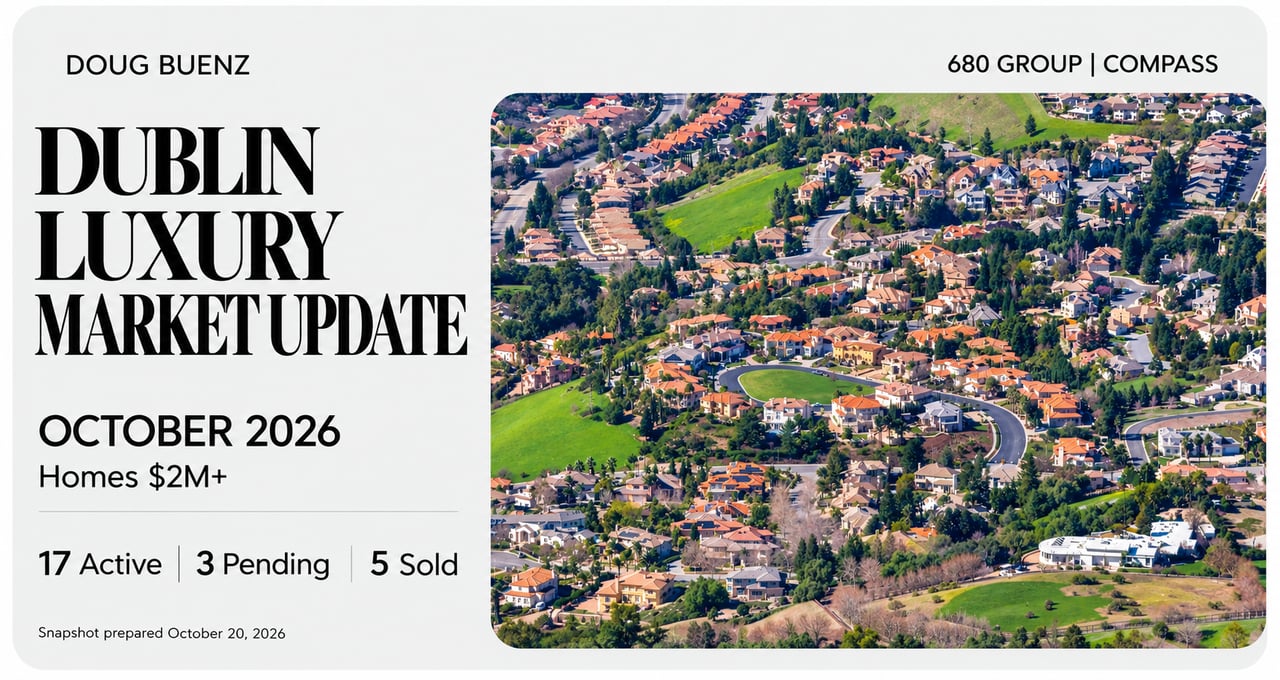
Seventeen active listings and five closings highlight the importance of property specific pricing
Market Update
Doug Buenz | October 16, 2026
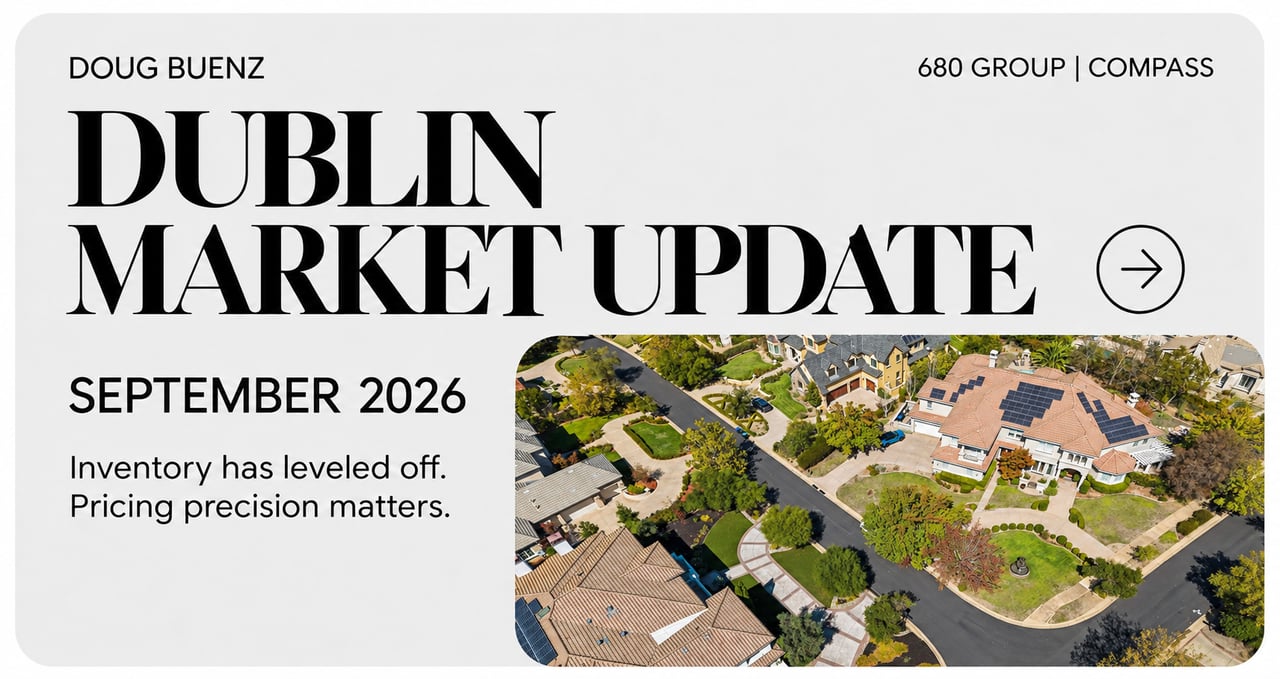
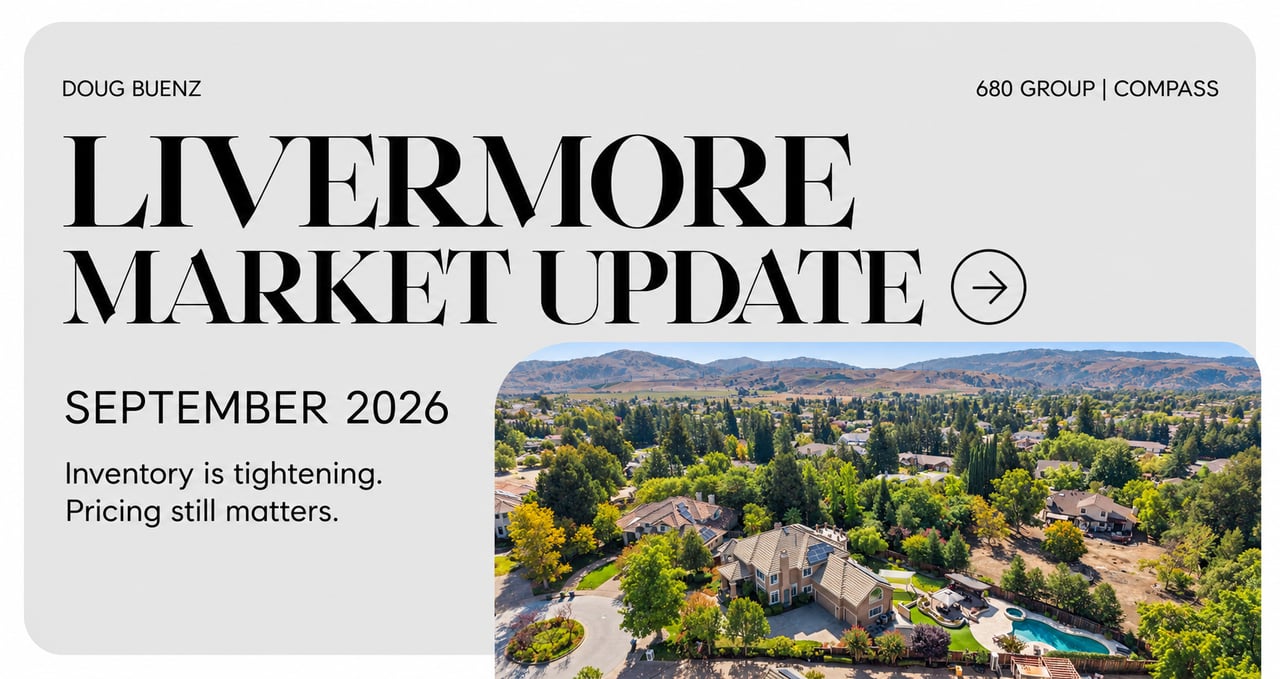
Inventory has leveled off, buyer activity has slowed, and accurate pricing is becoming increasingly important.
Market Update
Doug Buenz | October 12, 2026
Inventory has leveled off, buyer activity has slowed, and strategic pricing continues to shape results.

Market Update
Doug Buenz | October 9, 2026
Well-priced homes are selling quickly, while longer market times give buyers more negotiating room.
Market Update
Doug Buenz | September 21, 2026
Inventory remains elevated, absorption stays below 40%, and Dublin buyers are separating well-positioned homes from listings that miss the market.
Market Update
Doug Buenz | September 19, 2026
Pricing Precision Shapes the Early Fall Market
Market Update
Doug Buenz | September 15, 2026
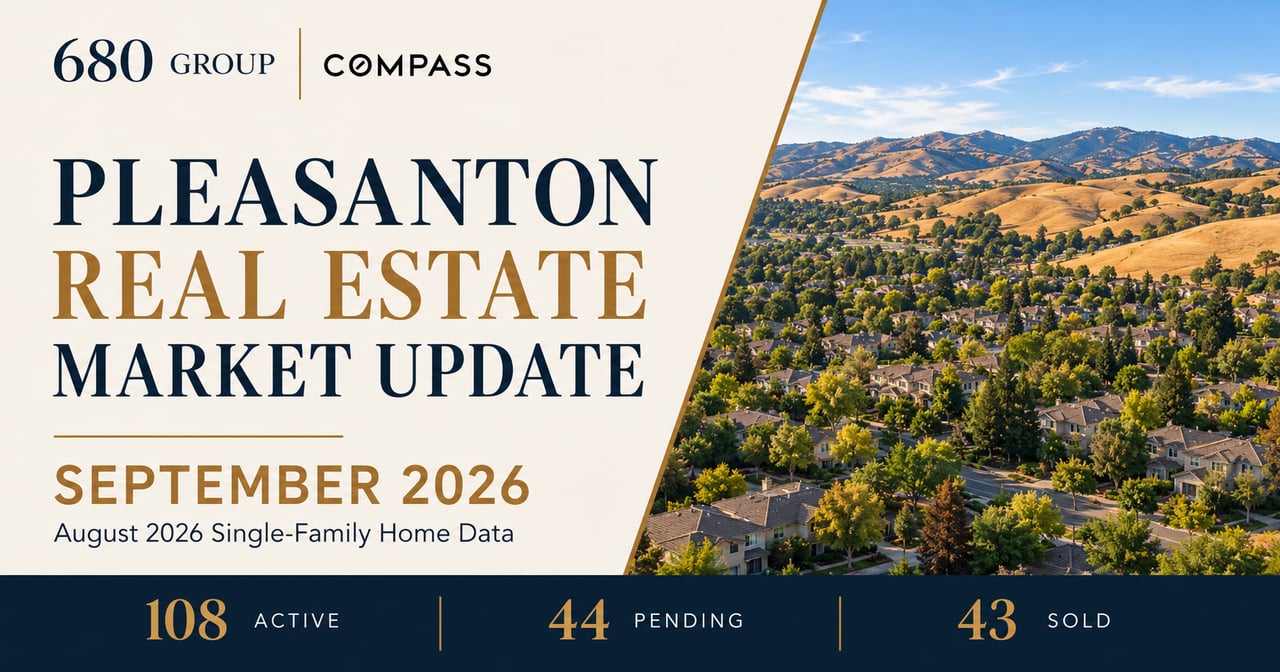
August 2026 single-family home data for Pleasanton, California, published September 2026

Doug Buenz | August 20, 2026
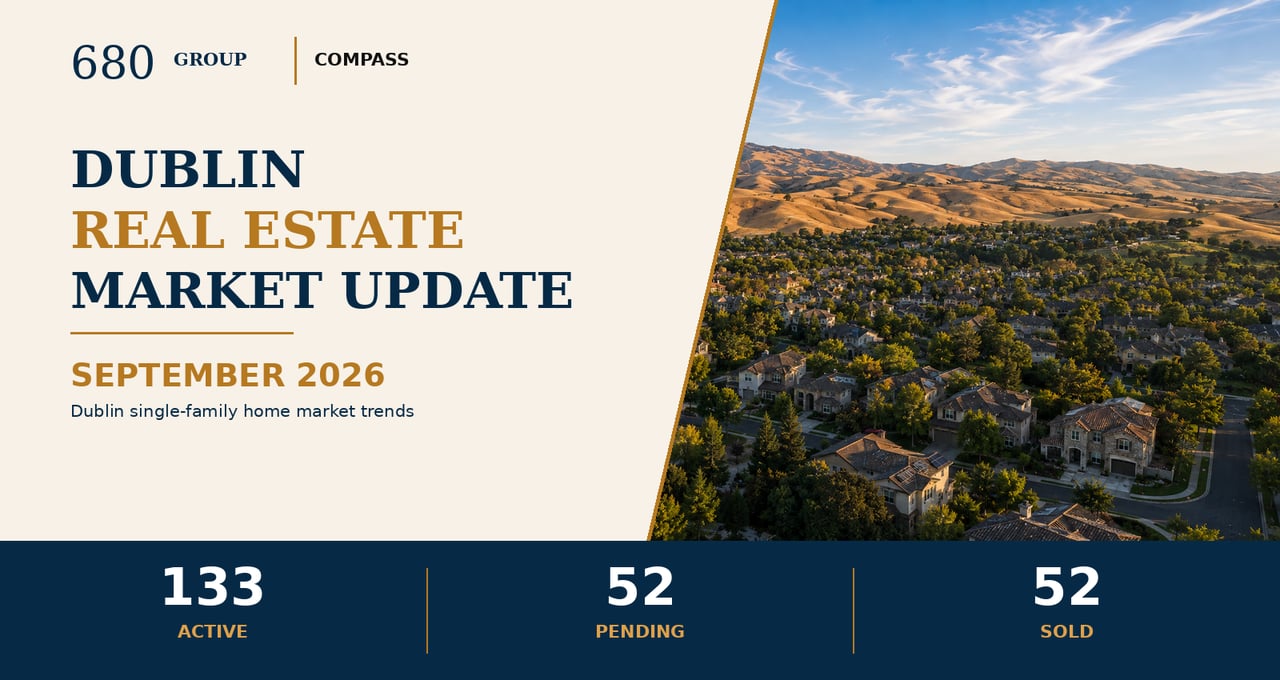
Dublin’s latest single-family home trends, including inventory, buyer demand, pricing, and days on market from July 15 through August 17, 2026.

Market Update
Doug Buenz | August 18, 2026
Pleasanton buyers have more choices, but well-priced homes can still sell at or above asking. Here’s what the latest single-family-home data means.