West Pleasanton Real Estate Market Update November 2026
Market Update
Market Update
About one month of supply, six closings and a clear price-per-foot ceiling for homes over 1,600 sq ft
By Doug Buenz | Report prepared November 3, 2026
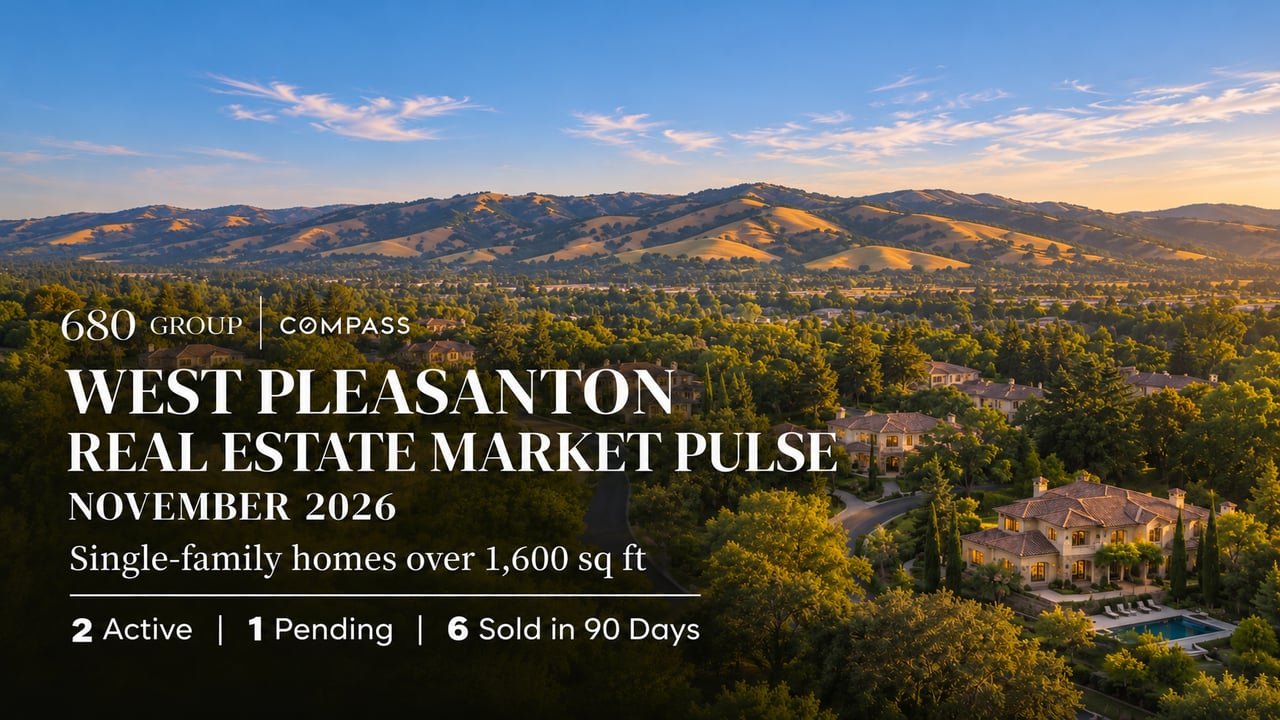
West Pleasanton's single-family market for homes over 1,600 square feet is about as tight as inventory gets. The MLS snapshot with data as of November 3, 2026 shows 2 active listings, 1 pending sale and 6 closings over the previous 90 days. Six closings in three months works out to about two a month, so the 2 active listings represent roughly one month of supply.
By most definitions that is a seller's market. Yet both active listings had been on the market for 27 and 46 days when the report was prepared. What I am seeing is that scarcity brings buyers to a home, but it does not stop them from checking recent sales before they make an offer.
Exact market data
All figures reproduce the report's printed values. The sold-to-list median compares each sale with its most recent list price, not its original list price. The closed figures include 4288 Tulipwood Court, which sold at $570 per square foot with zero days on market and closed the same day it left the market; excluding it, the median sold price per square foot is $796.
Months of supply here is the standard calculation: 2 active listings divided by an average of 2 closings a month over the trailing 90 days, or 1.0. With nine listings in the entire data set, one new listing or one closing moves that number substantially, so treat it as a description of the last 90 days rather than a forecast.
The single pending sale, 7761 Capewood Place, was listed at $773 per square foot and went under contract in seven days. The two active listings are asking $826 and $888 per square foot. Those are different homes with different features, but the gap is worth noticing.
Pricing and time on market
Based on 6 closed sales and 1 pending sale named in the report; the sixth closed sale is included in the medians but not named. Asking prices for Muirwood and Elmwood are original and reduced list prices. The Tulipwood sale went off-market and closed the same day, which suggests it was arranged before reaching the MLS.
The clearest pattern in this sample is price per square foot. Every 1960s and 1970s home in the report closed below $800 per square foot, most between $760 and $797. The one sale above that, 7331 Elmwood Circle at $855, was built in 1986 and has a pool. A quick contract did not guarantee a full price, either: 7352 Lemonwood Way went under contract in 25 days but closed at $760 per square foot against an $815 asking price, about $100,000 under list.
For sellers, my experience indicates that low inventory helps only when the first price reflects what comparable homes have actually sold for. Two sellers in this report started high and reduced. 4622 Muirwood Drive closed at about 93.0% of its original list price after 81 days, and 7331 Elmwood Circle at about 88.6% after 78 days. Together they closed $310,388 below where they started. Those ratios were calculated from the prices printed in the report, and two sales cannot prove that the reductions caused the result. Homes that start too high are often the ones that end up needing a reduction.
The report's 98.3% median sold-to-list figure looks strong, but it measures sale price against the most recent list price. For a home that has already been reduced, that hides the reduction. Original list price is the better yardstick when you are deciding where to start.
A practical starting point is the price per square foot that comparable homes actually closed at, adjusted honestly for condition, size and updates.
If you’re considering selling, you can request a home valuation to see how your property compares with recent sales.
What buyers can take from the snapshot
With two active listings, buyers in this segment have very little to choose from right now. Expect a well-priced home to move quickly; the pending sale went under contract in a week. At the same time, closed sales show that buyers here have held to recent comparable prices, even when inventory is short. Listings asking well above recent closed prices per square foot may leave room to negotiate, particularly once they have been on the market for several weeks.
Active asking prices, the pending asking price and closed prices per square foot describe different sets of homes. Their differences should not be read as market appreciation, depreciation or an expected discount.
To see what’s available now, browse Pleasanton homes for sale.
The report covers a rolling 90 days and supplies no prior-period comparison. It therefore does not establish a rising or falling price trend, a market-wide negotiating discount or a guaranteed selling timeline. With nine listings in the data set, a property-specific analysis remains the useful next step.
For citywide context, see the September 2026 Pleasanton real estate market update.
How many West Pleasanton homes over 1,600 square feet are for sale?
The MLS snapshot with data as of November 3, 2026 shows 2 active single-family listings over 1,600 square feet in West Pleasanton, plus 1 pending sale. Six homes in this segment closed over the previous 90 days.
How many months of supply does West Pleasanton have?
About 1.0 month. Six homes over 1,600 square feet closed in 90 days, roughly two a month, against 2 active listings. With samples this small, one new listing or one sale changes the figure noticeably.
What are West Pleasanton homes selling for per square foot?
The six closed sales had a median sold price of $1.43 million and a median of $778 per square foot. Excluding one zero-day sale at $570 per square foot, the median is $796. The highest was $855 per square foot, for a 1986 home with a pool.
Are West Pleasanton homes selling at asking price?
The median sale closed at 98.3% of its most recent list price. That measure ignores earlier price cuts. Two homes that reduced their price closed at about 93.0% and 88.6% of their original list prices, based on prices printed in the report.
How long are West Pleasanton homes taking to sell?
Closed sales had a median of 52 days on market. The two active listings had been on the market 27 and 46 days, and the one pending home went under contract in seven days. These are different homes, not a timeline for any single property.
Does starting with a high list price cost West Pleasanton sellers?
In this six-sale sample, two homes that opened high and then cut their price closed a combined $310,388 below their original asking prices after 78 and 81 days. A home listed at $773 per square foot went pending in seven days. Six sales show a pattern worth weighing, not a rule.
Considering buying or selling a home in West Pleasanton? Contact Doug Buenz at (925) 621-0680 or visit 680homes.com for a property-specific review of recent sales, current listings and a pricing or offer strategy.
Doug Buenz is the founder of The 680 Group at Compass and a leading luxury real estate agent in Pleasanton, California with over $1.2 billion in sales across 35 years.
CA DRE #00843458 | 900 Main Street, Suite 101, Pleasanton, CA 94566
Methodology and source notes
Source: West Pleasanton Market Update (Seller Summary), data as of November 3, 2026, supplied as Seller_Summary_West_Pleasanton_SFH_1600plus_90day.pdf. Scope: West Pleasanton single-family homes over 1,600 square feet that were active, pending or closed in the 90 days before the report date, nine listings in all. MLS sources: Bay East, CCAR and bridgeMLS.
Months of supply equals active listings divided by average monthly closings over the trailing 90 days: 2 ÷ (6 ÷ 3) = 1.0. The report's median sold-to-list ratio (98.3%) compares each sale price to that home's most recent list price, so it does not capture earlier price reductions. Where this article compares a sale with its original list price (OLP), the ratio was computed from prices printed in the report and is labeled as such.
Closed figures include 4288 Tulipwood Court, which closed at $570 per square foot with zero days on market, going off-market and closing the same day. That pattern suggests a sale arranged before MLS exposure. Excluding it, the median sold price per square foot is $796 rather than $778. Only six closed sales underpin the sold statistics, and one transaction can move any median materially. The figures describe a 90-day window, not the calendar month of November, and should not be read as a trend or forecast. Active, pending and sold figures describe different homes.
Fair Housing and brokerage disclaimer
The 680 Group is a team of real estate agents affiliated with Compass, a real estate broker licensed by the State of California (License #01527235), which abides by Equal Housing Opportunity laws. Data compiled from MLS sources deemed reliable but not verified. If your property is currently listed for sale, this is not a solicitation.
Housing opportunities and real estate services are offered without discrimination on the basis of any characteristic protected by applicable federal, state or local law. This update discusses property and market data; it does not express a preference for, limitation on, or exclusion of any person or group. Market information is general and does not guarantee a price, sale or investment result.
Stay up to date on the latest real estate trends.
Market Update
Doug Buenz | November 11, 2026
About one month of supply, six closings and a clear price-per-foot ceiling for homes over 1,600 sq ft
Pleasanton luxury real estate
Doug Buenz | October 23, 2026
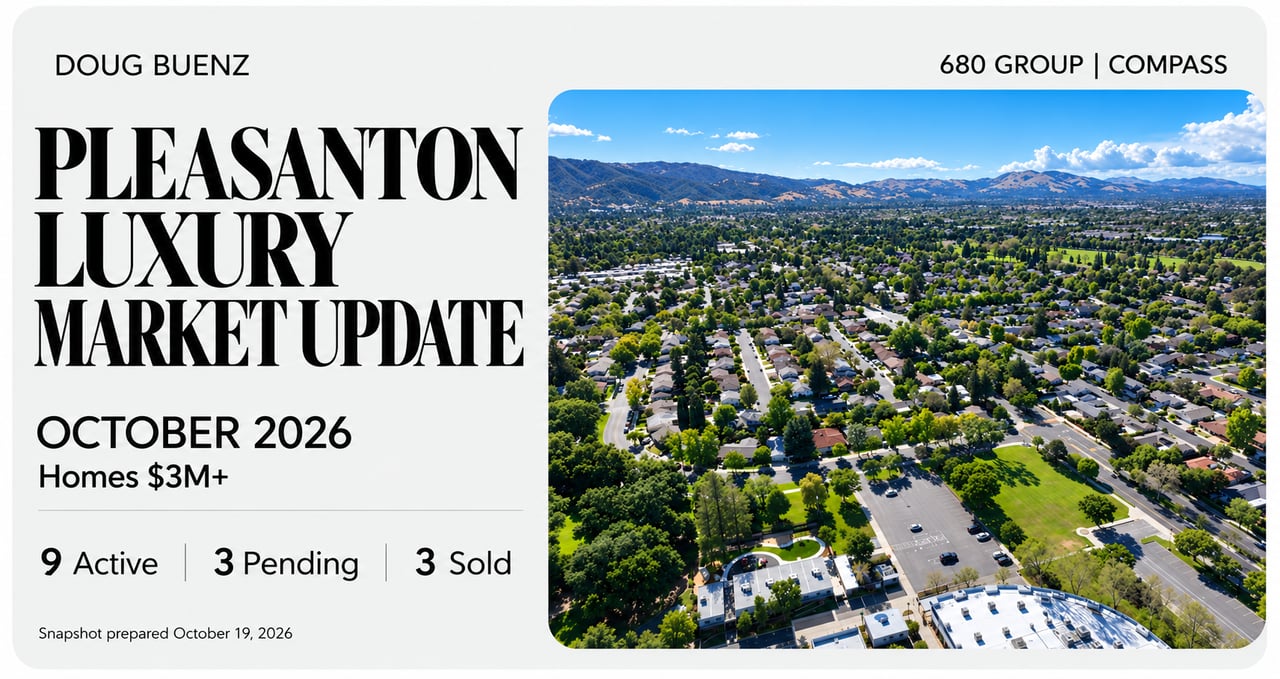
Two distinct markets: Limited inventory below $4 million, more choices at higher prices, and why strategic pricing matters.
South Livermore
Doug Buenz | October 22, 2026
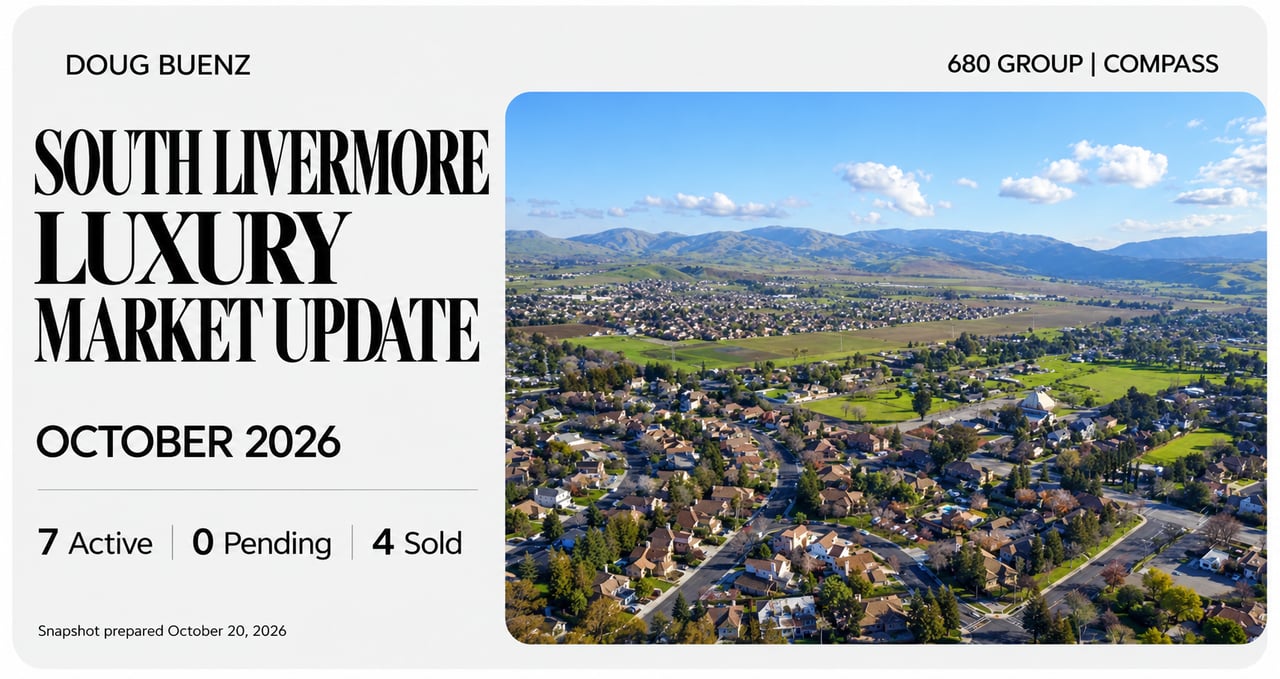
Seven luxury homes are on the market in South Livermore, with no pending sales. Four closings show how time on market relates to sale-to-list results.
Tri-Valley real estate
Doug Buenz | October 21, 2026
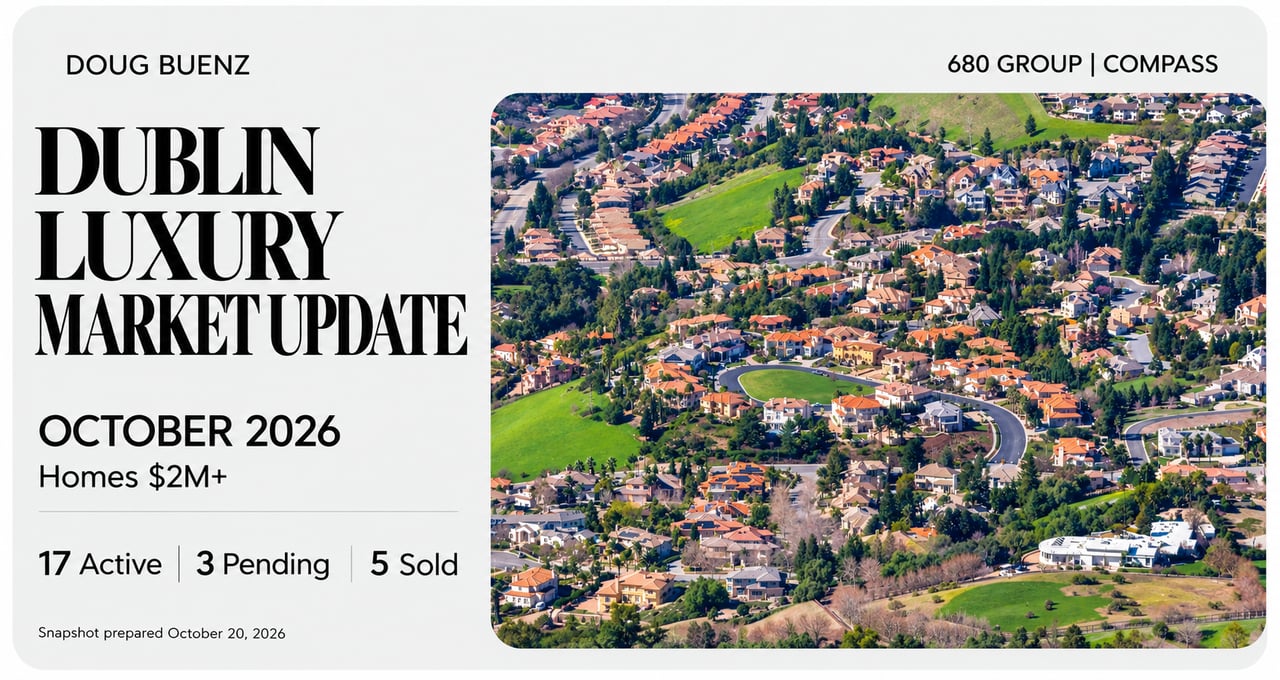
Seventeen active listings and five closings highlight the importance of property specific pricing
Market Update
Doug Buenz | October 16, 2026
Inventory has leveled off, buyer activity has slowed, and accurate pricing is becoming increasingly important.
Market Update
Doug Buenz | October 12, 2026
Inventory has leveled off, buyer activity has slowed, and strategic pricing continues to shape results.

Market Update
Doug Buenz | October 9, 2026
Well-priced homes are selling quickly, while longer market times give buyers more negotiating room.
Market Update
Doug Buenz | September 21, 2026
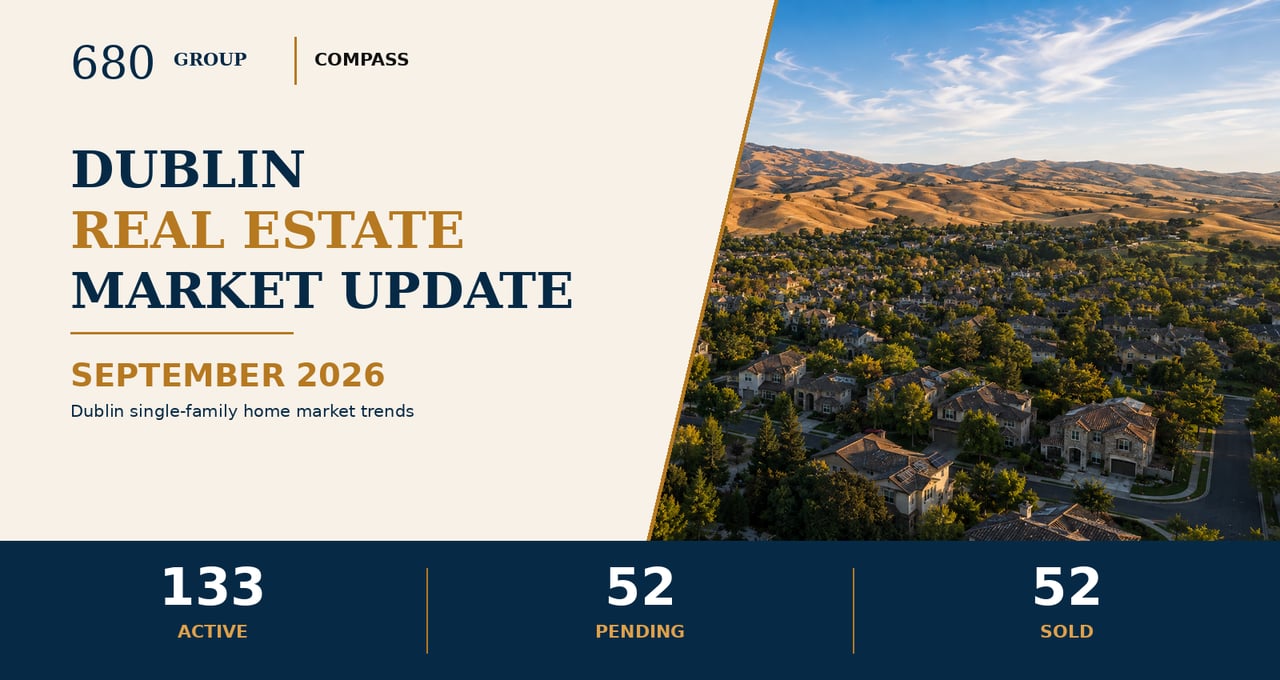
Inventory remains elevated, absorption stays below 40%, and Dublin buyers are separating well-positioned homes from listings that miss the market.
Market Update
Doug Buenz | September 19, 2026
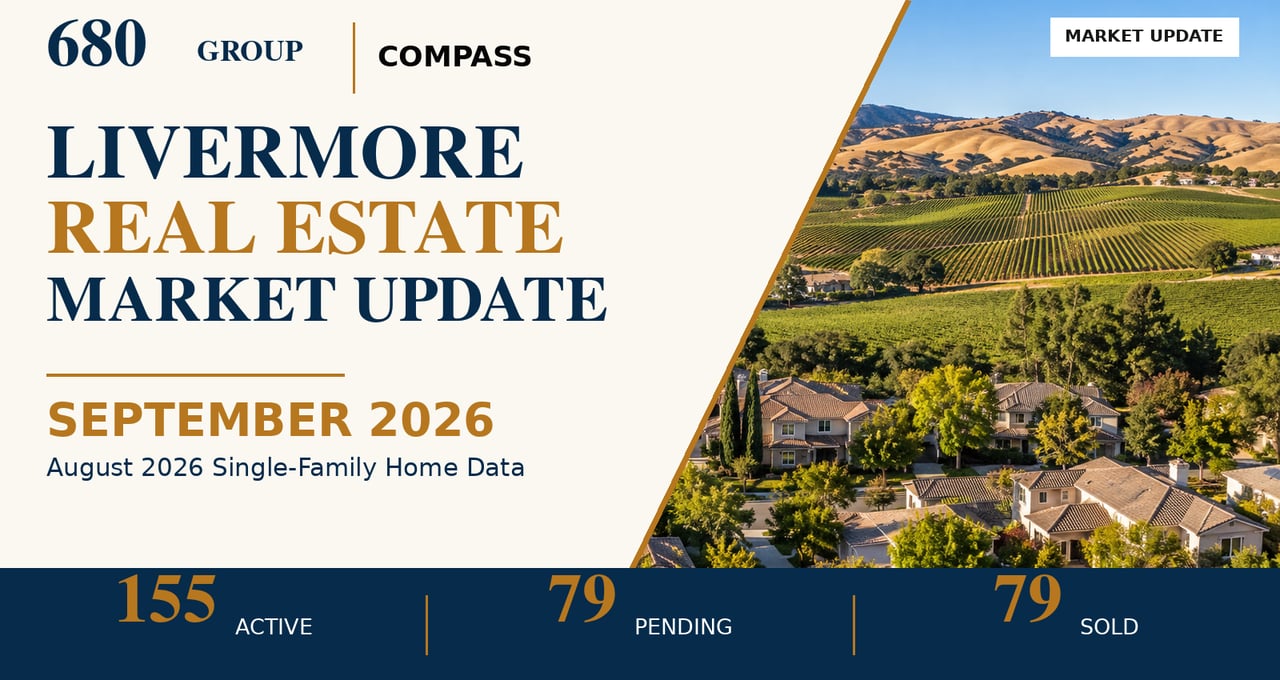
Pricing Precision Shapes the Early Fall Market