Pleasanton Real Estate Market Update | September 2026
Market Update

Market Update
Pleasanton Market Pulse Report
Single-Family Homes · Pleasanton, CA · September 2026
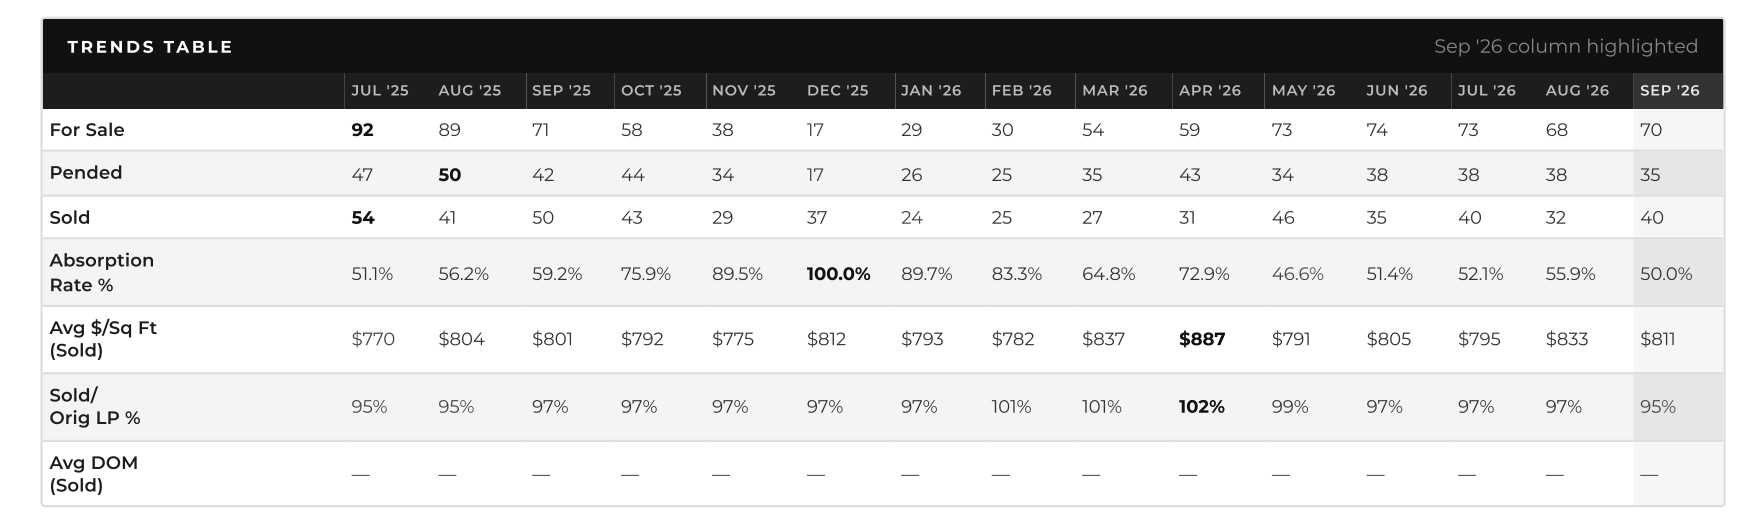
Inventory has leveled off. There are 70 homes on the market in Pleasanton, compared with 74, 73 and 68 in June, July and August. Pending sales eased again this month and are running behind where they were a year ago. Absorption has followed to 50% — roughly half of what is standing finds a buyer in a given month. That is a market that still favors a well-prepared seller.The number worth sitting with is the gap between what is listed and what is selling. Active listings have been sitting an average of 56 days. The homes that actually closed took 41. The inventory on the shelf is 15 days older than the inventory moving off it. Currently I am seeing homes priced for engagement selling quickly, often over the asking price. Homes that are priced aspirationally are experiencing sluggish market conditions, with price reductions in the cards.
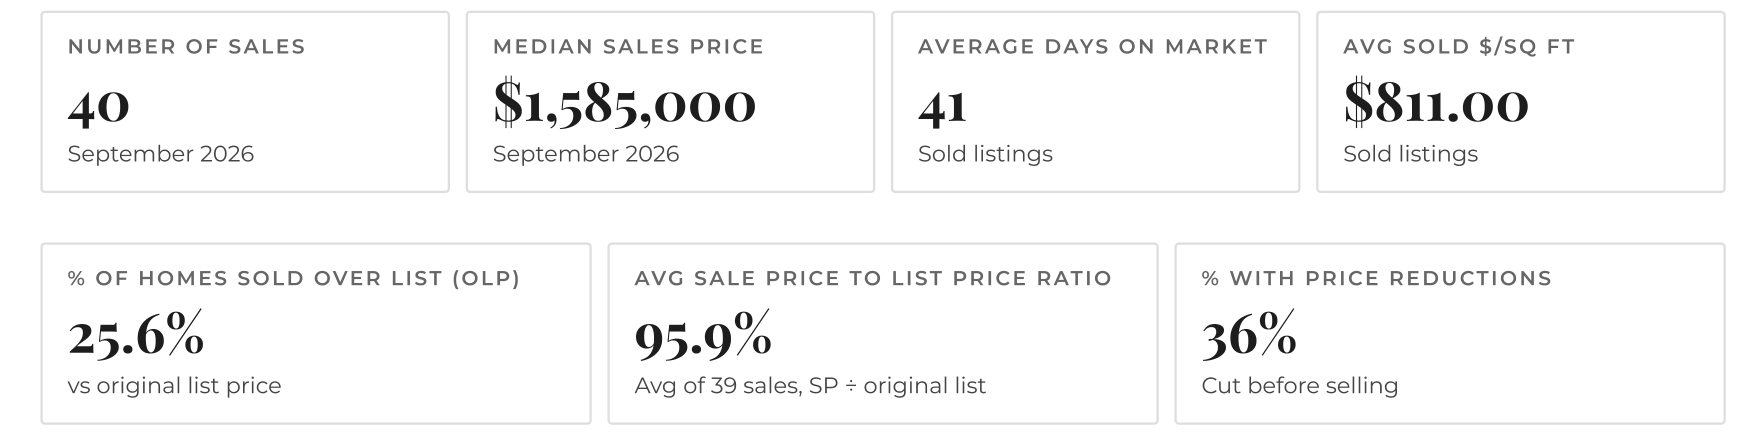
If you're sellingThe market is still rewarding sellers who get it right. 25.6% of homes sold above original asking price — yours can be one of them. But that outcome requires pricing for engagement, not to hope. It requires presentation that earns attention and a marketing strategy that finds the right buyer before they find the next listing. This is the difference between the 25.6% that sold over ask and the 32% still cutting price to get noticed.
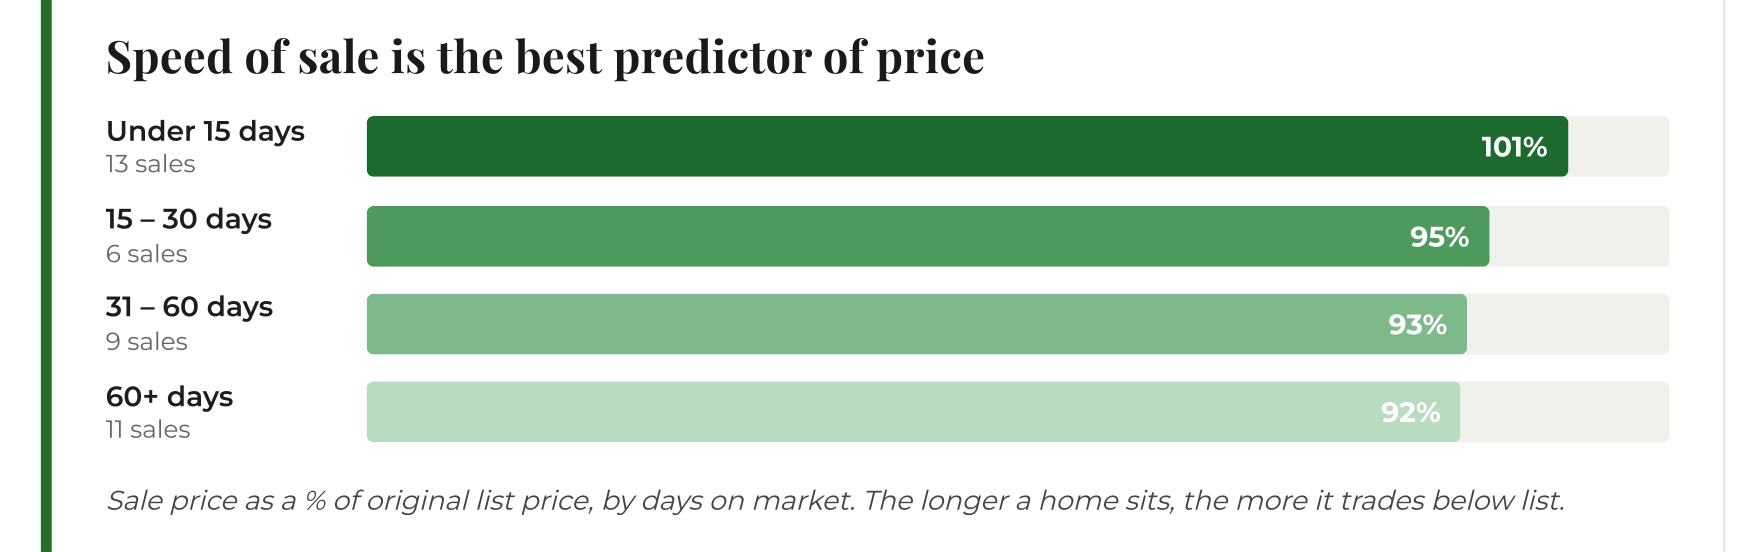
If you're buying Active listings are sitting an average of 56 days before going under contract. Homes beyond 30 days on market — averaging 93% of original ask — are almost always negotiable. What I am seeing is a continued emphasis on days on market right now. The longer a home sits, the stronger your position is as a buyer. Get pre-approved, know your number, and move when you find the right home.

Data for the month of September 2026
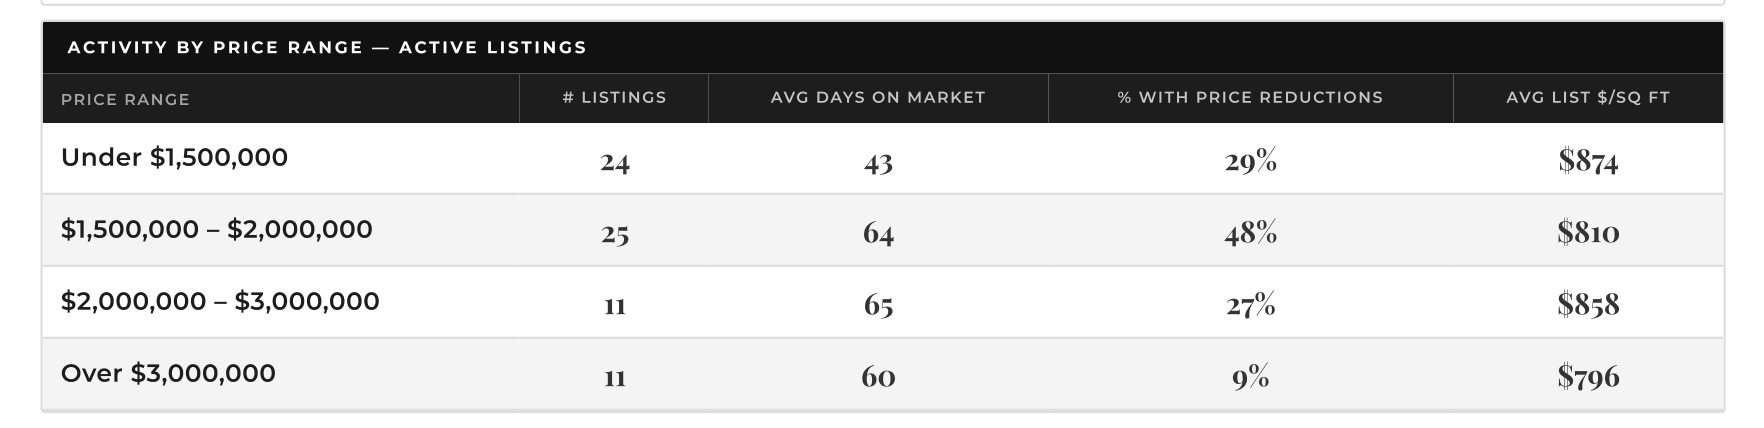
Inventory stands at 70 active listings, compared with 74, 73 and 68 in June, July and August and down from 71 a year ago. That’s right in line with the three-month average of 72. What’s on the shelf has been there an average of 56 days. 32% have already taken a price reduction — nearly one in three sellers has adjusted expectations, and the ones who haven’t are usually next.

Data for the month of September 2026
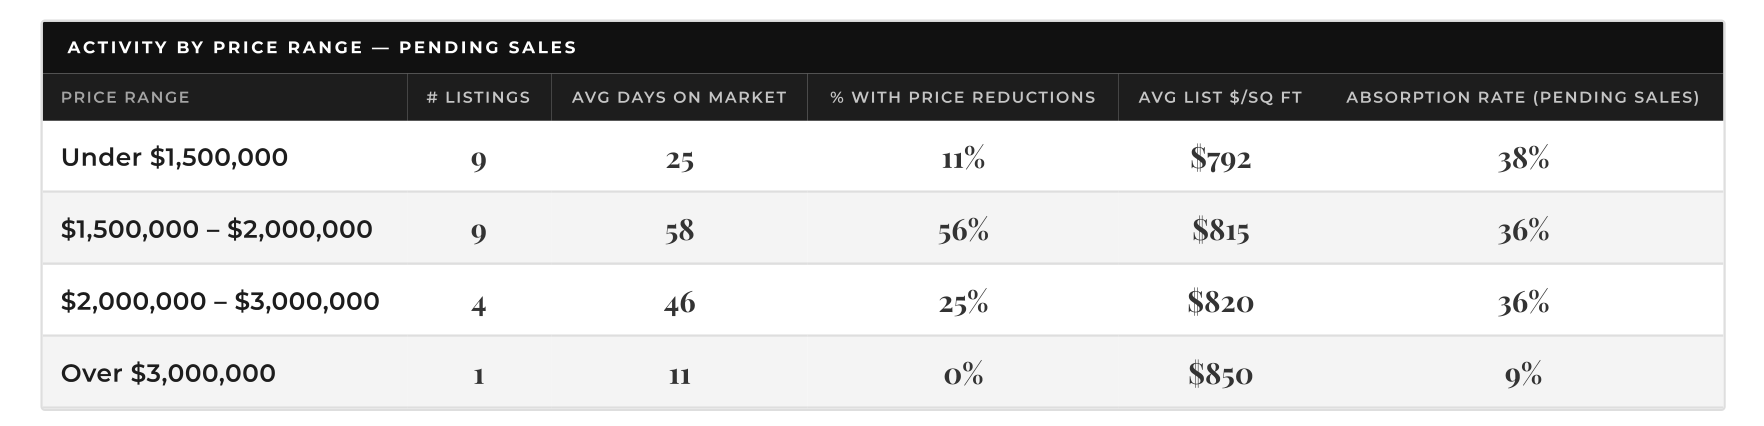
35 homes went under contract, down from 38 in Aug '26 and down from 42 a year ago. That puts absorption at 50%. Roughly half of standing inventory clears in a month. Balanced, and unforgiving of a stretch price. Pendings averaged 41 days on market before going under contract, and 30% cut their price before they found a buyer.
Data for the month of September 2026
40 homes closed, up from 32 in Aug '26 and down from 50 a year ago. The median landed at $1,585,000, or $811.00 per square foot. The average home sold for 96% of its original asking price, off the peak of 102.0% in Apr '26, and 25.6% closed above original list.
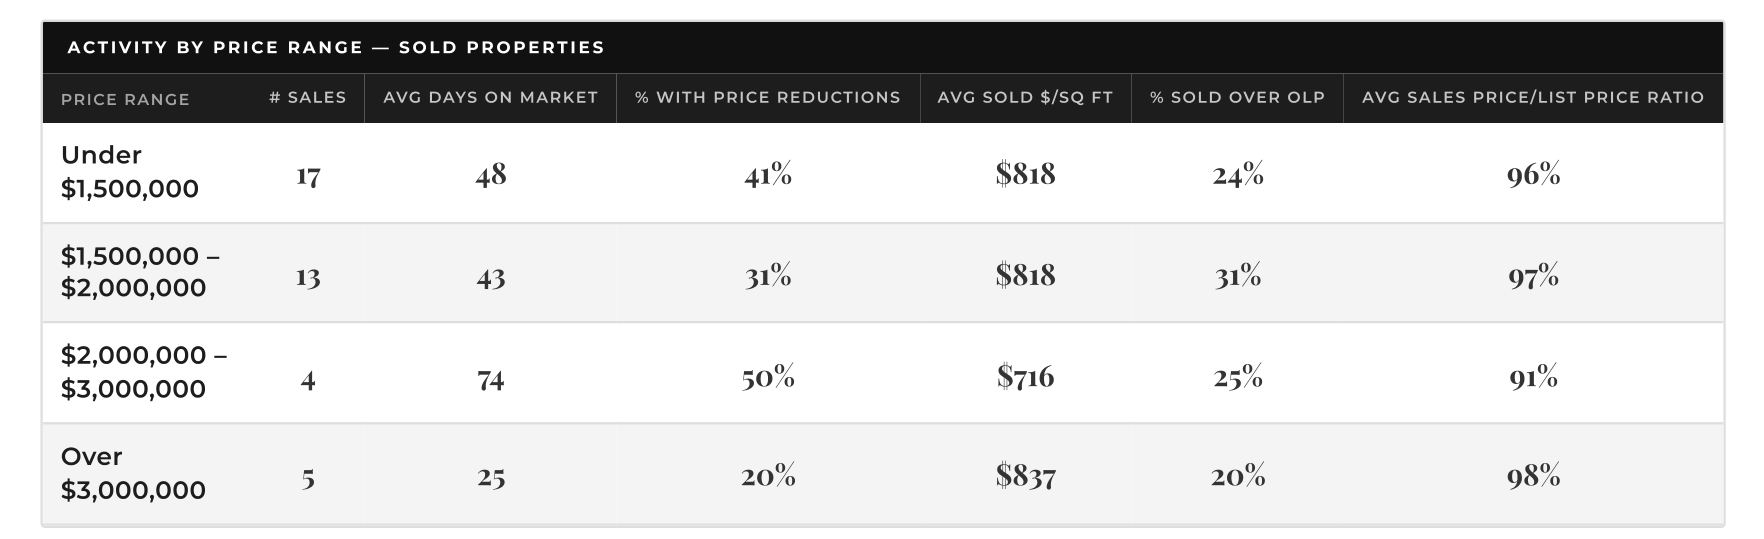
The speed-of-sale chart at the top of this report is the one to read twice. Homes that sold inside 15 days averaged 101% of original ask. Homes that sat past 30 days averaged 93% — and there were 13 of the former and 20 of the latter. 8 points of price separate them, and the only variable is time. Speed of sale isn’t a happy accident. It is what correct pricing looks like from the outside. 36% of these sellers cut their price before closing.
October 2024 – October 2026 · Freddie Mac PMMS
Currently 7.28%. Rates bottomed at 5.98% in February 2026 and have climbed every month since. That floor followed Federal Reserve cuts in late 2025, but bond yields have moved sharply the other way through the second half of 2026. At 7.28% (October 1, 2026) this is the highest reading on this chart — up 130 basis points from the February floor.
The 30-year fixed rate sits at 7.28%. A half-point move lower from here would meaningfully expand the buyer pool in the $1.5M–$2.5M range. Watch absorption through next month. If it holds above 50%, the fall will be tighter than most expect — unsold listings get withdrawn, inventory contracts, and demand doesn’t disappear. We know this market. We know your neighborhood. We know the pulse.
Data through September 2026 · Source: TrendGraphix / MLS · 15-Month Trend Analysis · Freddie Mac PMMS · Prepared by The 680 Group at Compass
Let’s talk about what this market means for you.
Doug Buenz
Founder & Team Leader
The 680 Group | Compass
(925) 621-0680
[email protected]
900 Main Street, Suite 101
Pleasanton, CA 94566
Lic #00843458
Stay up to date on the latest real estate trends.
Market Update
Doug Buenz | October 9, 2026
Well-priced homes are selling quickly, while longer market times give buyers more negotiating room.
Market Update
Doug Buenz | September 21, 2026
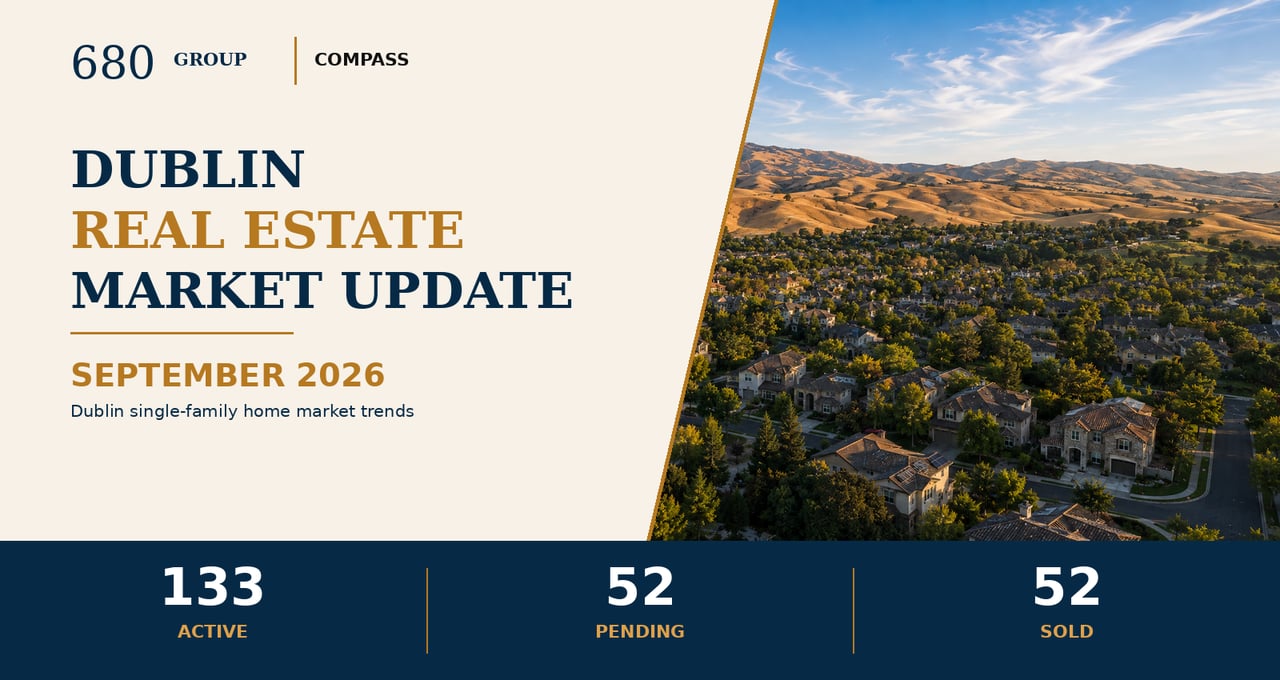
Inventory remains elevated, absorption stays below 40%, and Dublin buyers are separating well-positioned homes from listings that miss the market.
Market Update
Doug Buenz | September 19, 2026
Pricing Precision Shapes the Early Fall Market
Market Update
Doug Buenz | September 15, 2026
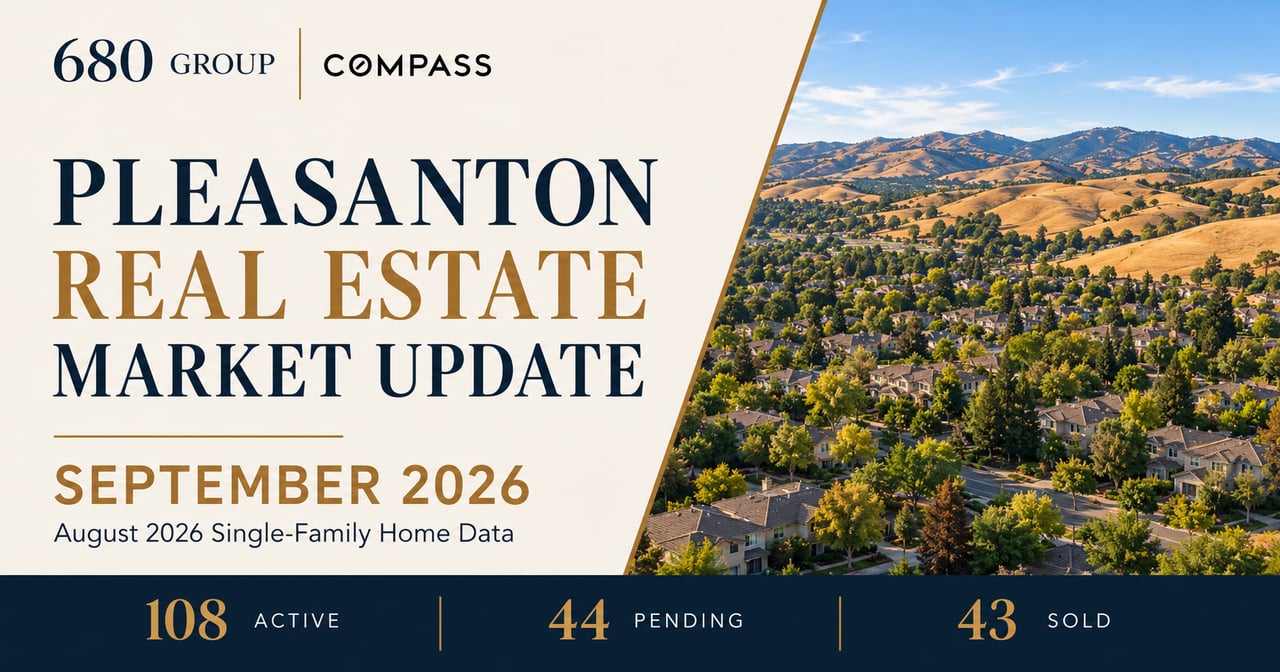
August 2026 single-family home data for Pleasanton, California, published September 2026

Doug Buenz | August 20, 2026
Dublin’s latest single-family home trends, including inventory, buyer demand, pricing, and days on market from July 15 through August 17, 2026.

Market Update
Doug Buenz | August 18, 2026
Pleasanton buyers have more choices, but well-priced homes can still sell at or above asking. Here’s what the latest single-family-home data means.

Market Update
Doug Buenz | August 18, 2026
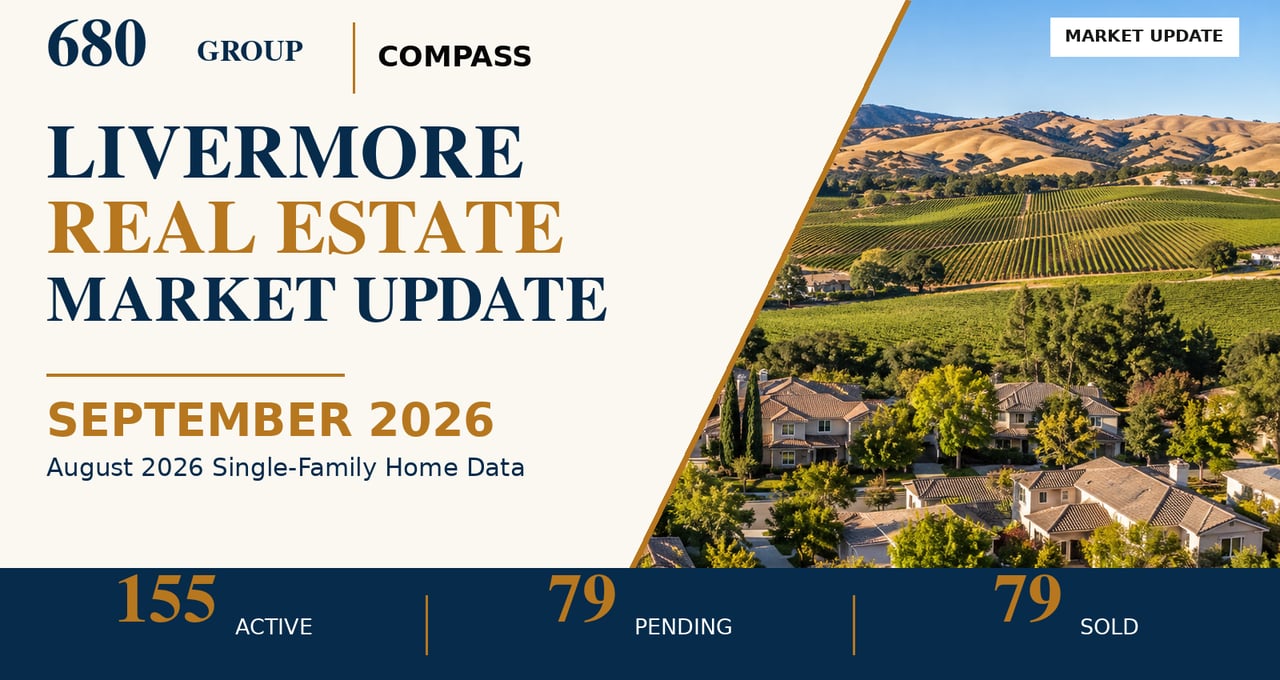
South Livermore’s market is tight enough to reward decisive buyers, but recent closed sales show that sellers still need to price with discipline.

Market Update
Doug Buenz | August 7, 2026
August 2026 Update: Well-positioned homes sold quickly and averaged 102% of asking, while homes taking over 30 days averaged just 94%.

Pleasanton Real Estate
Doug Buenz | July 28, 2026
The most common reasons Pleasanton homes fail to attract offers—and what sellers should consider before relisting.