Pleasanton Real Estate Market Update October 2025
Market Trends

Market Trends
The Pleasanton real estate market seemed to see some benefit from a dose of optimism due to the Fed lowering the Federal Funds rate by .25%. Average mortgage rates saw a decline as well, adding optimism that a stronger market is in the works. However, the data suggests that there are still mixed signals in the market.
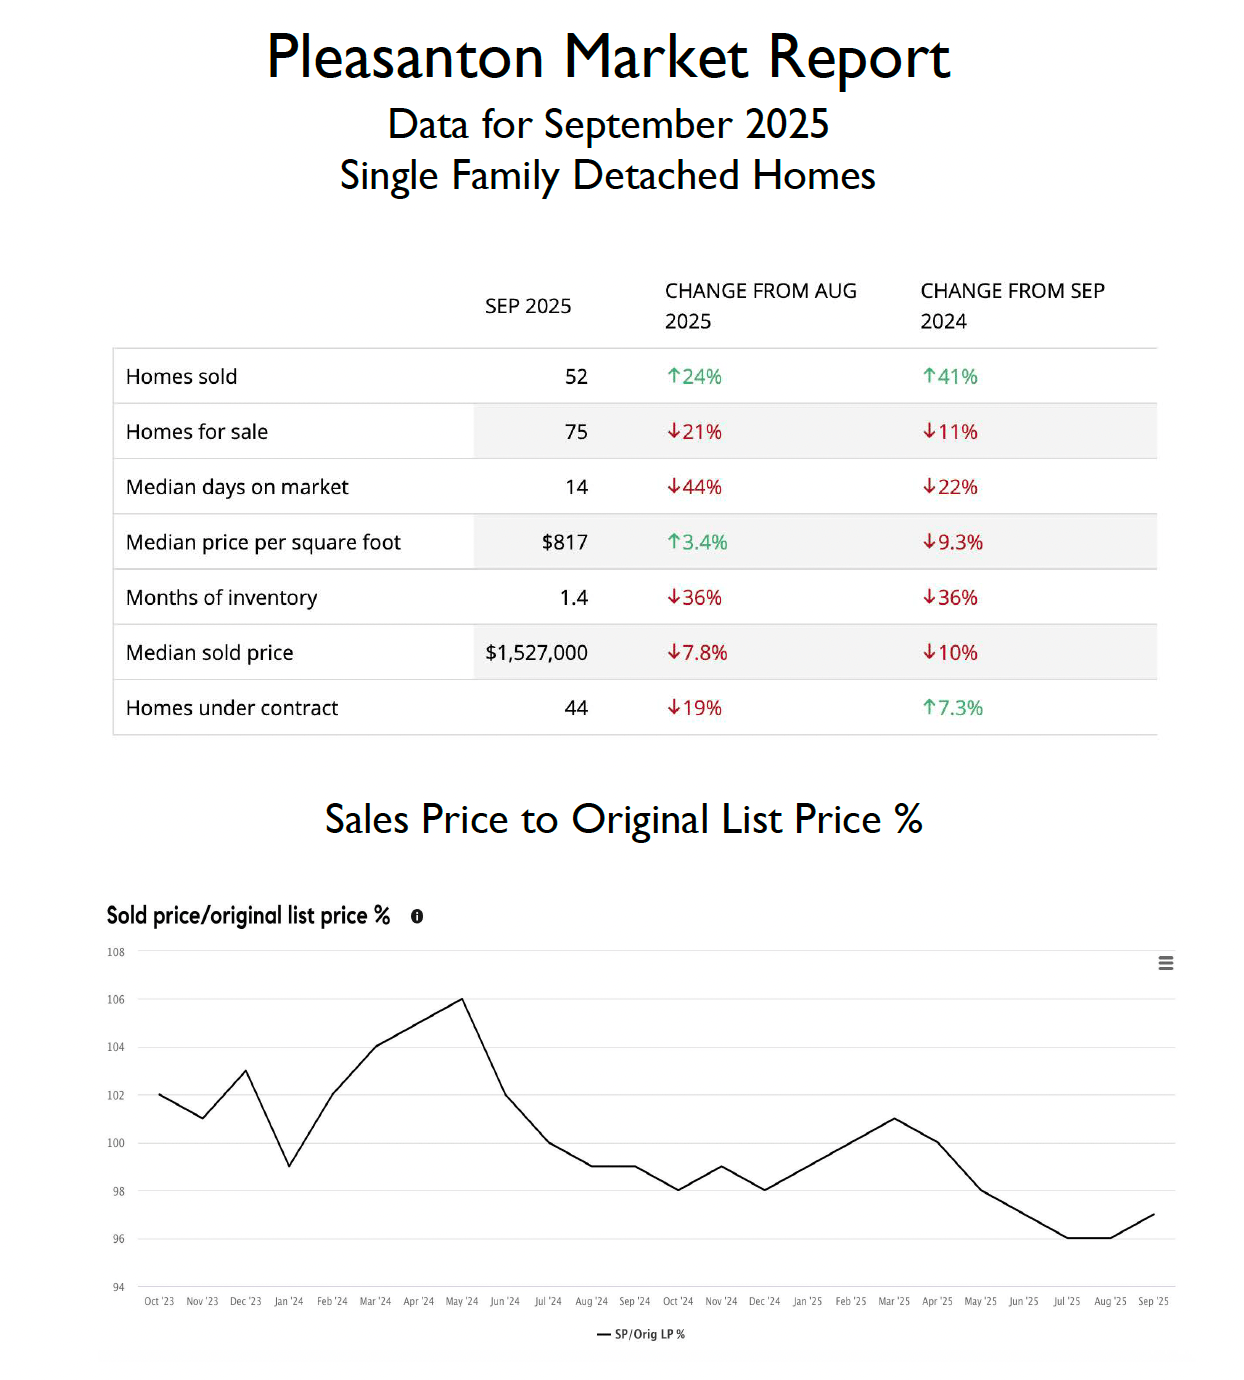
Let’s take a dive into the numbers for September:
Inventory Lower: The inventory of available single-family homes slid to 75 homes for sale at the end of September, a 21% decrease from the 91 homes for sale at the end of August and 25% lower than the 99 homes for sale at the end of July. This is also 11% lower than September of last year. It is not unusual to see lower inventory in the Fall, and this year seems to follow that trend. Lower inventory means fewer choices for buyers, and in some cases may put pressure on buyers to make stronger offers.
Demand is Mixed: Pending sales (homes under contract) declined 19% in September, with 44 pending sales for the month, down from 55 in August. It is however 7.3% higher than September of last year. However, closed sales were up 24% in September with 52 closings, up from 42 closed sales in August. This is still lower than the 54 closed sales in July and 63 in June. This is also 41% higher than September of last year. Median days on market for closed sales was 14 in September, a 44% drop from August’s figure of 25 and a 22% decline from September of 2024. Average days on market for Active listings in Pleasanton stands at 60, showing that most homes are simply taking longer to sell.
Price Data Mixed: The median sold price in September came in at $1,527,000, down 7.8% from the August figure of $1,657,000. For reference, the median sold price stood at $1,770,000 in June. It is also down 10% from September of 2024. The median sold price per sq ft rose slightly to $817, a 3.4% increase from the August figure of $790. However, this is 9.3% lower than the figure for September of last year. For added perspective, the average sold price per sq ft earlier this year was $884 per sq in March, $866 in April, and $864 in May. The average sales price to lists price ratio, another good gauge on how hot the market is, was up 1% to 97%, which indicates that most homes are selling 3% below their asking price on average. For reference, the peak of sales price to list price ratio was 106% in May of 2024. However, because this is an average, the reality is that many homes sell close to or even over asking, and others sit on the market with price reductions. Indeed, approximately 40% of the current listings have had price reductions.
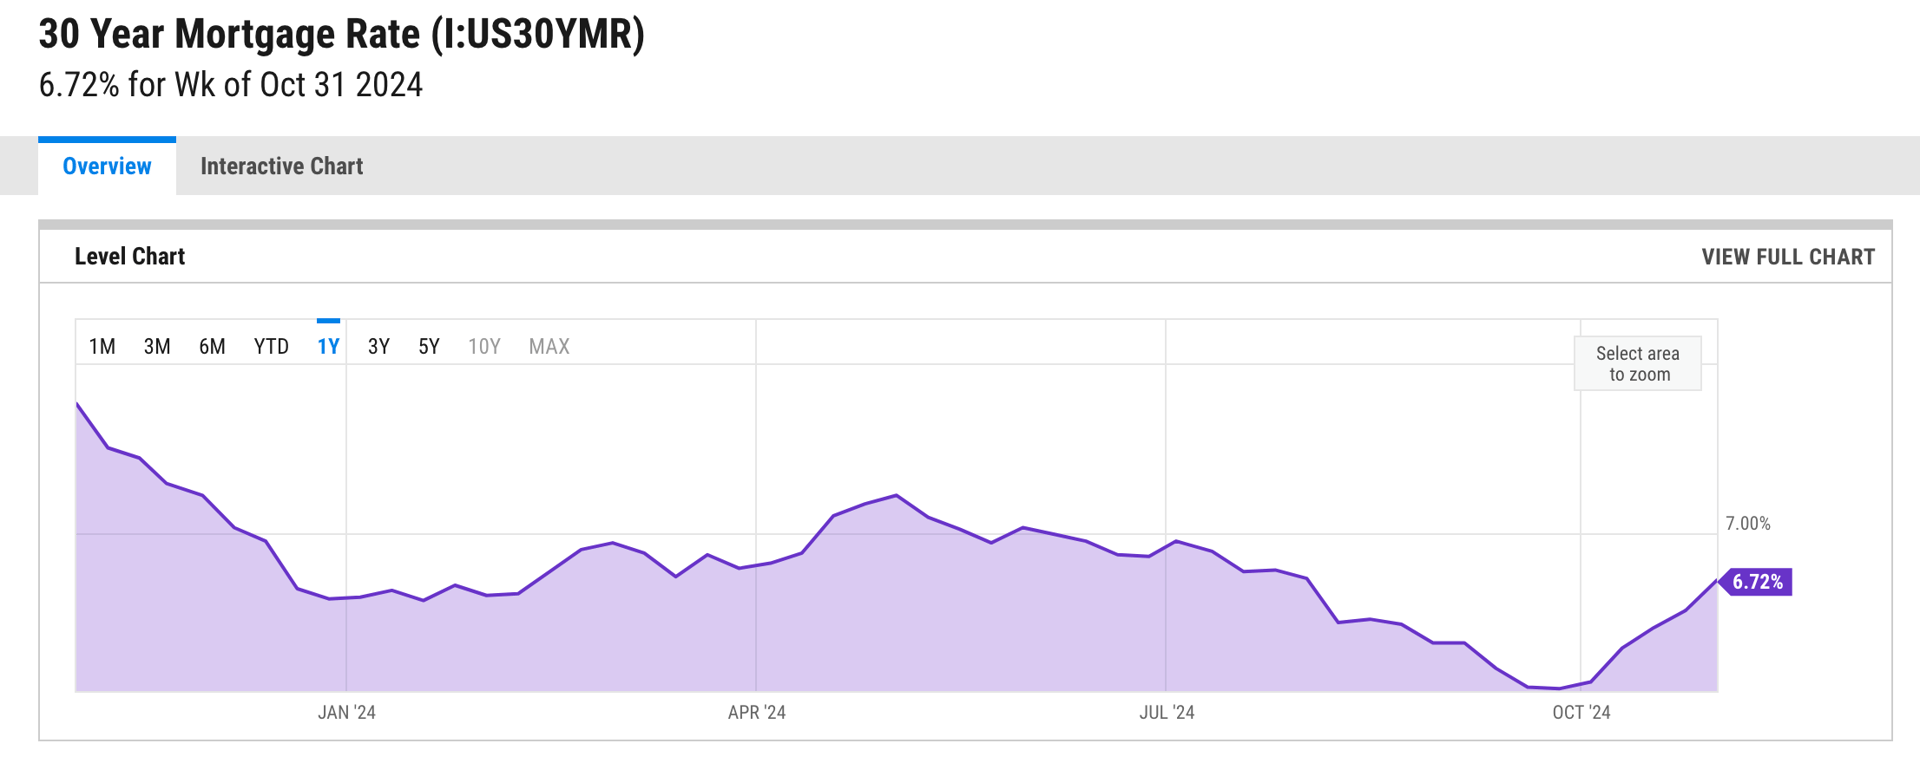
Interest Rates Drift Downward: Average 30-year fixed mortgage rates continued to drift downward, dropping about .30% from the beginning of September (6.56%) to a low of 6.26% in the middle of September. However, when the Fed finally did lower the Federal Funds rate on September 17th, mortgage rates actually rose slightly, closing out the month at an average of 6.34%. Most experts are thinking this is a temporary rise and expect to see continued easing of mortgage rates this year.
Economic/Other Considerations: The economy continues to show mixed signals. Inflation remains manageable, although concern about the effects of tariffs continues to be a wild card. The stock market remains very strong with periods of volatility. There is some concern about unemployment, especially in the tech sector of the Bay Area. And interest rates, specifically mortgage rates, remain stubbornly high, but have trended lower since mid-Summer. Everyone is hoping we can see mortgage rates ease further, which should add some strength to the housing market. Fingers crossed…
Stay up to date on the latest real estate trends.

Market Update
Doug Buenz | July 21, 2026
More Inventory, Selective Buyers, and Uneven Results for Sellers

Market Trends
Doug Buenz | July 21, 2026
Single-family home activity included in the MLS snapshot from June 15 through July 20, 2026

Pleasanton Neighborhoods
Doug Buenz | July 10, 2026
Compare Pleasanton's most popular neighborhoods by home prices, architectural styles, commute access, parks, recreation, and local amenities to find the community that… Read more

Neighborhood Guide
Doug Buenz | July 4, 2026
Pleasanton CA Neighborhoods: Complete Guide to Every Community (2026)
Market Trends
Doug Buenz | June 15, 2026
39% of Pleasanton Homes Sold Over Asking in May. Here's the Rest of the Story.

Market Trends
Doug Buenz | May 8, 2026
Mixed Signals Persist in the Pleasanton Market
Market Trends
Doug Buenz | April 9, 2026
Mixed Signals in the Pleasanton Market

Market Trends
Doug Buenz | December 10, 2025
Holiday Hibernation
Market Trends
Doug Buenz | October 9, 2025
A Fall Rally?