Pleasanton Real Estate Market Update December 2025
Market Trends

Market Trends
The Pleasanton real estate slowed in November, to no one’s surprise. The market typically slows as we enter the holidays, and this year is no exception. Inventory, pending sales, and closed sales all trended lower.
Let’s take a dive into the numbers for November
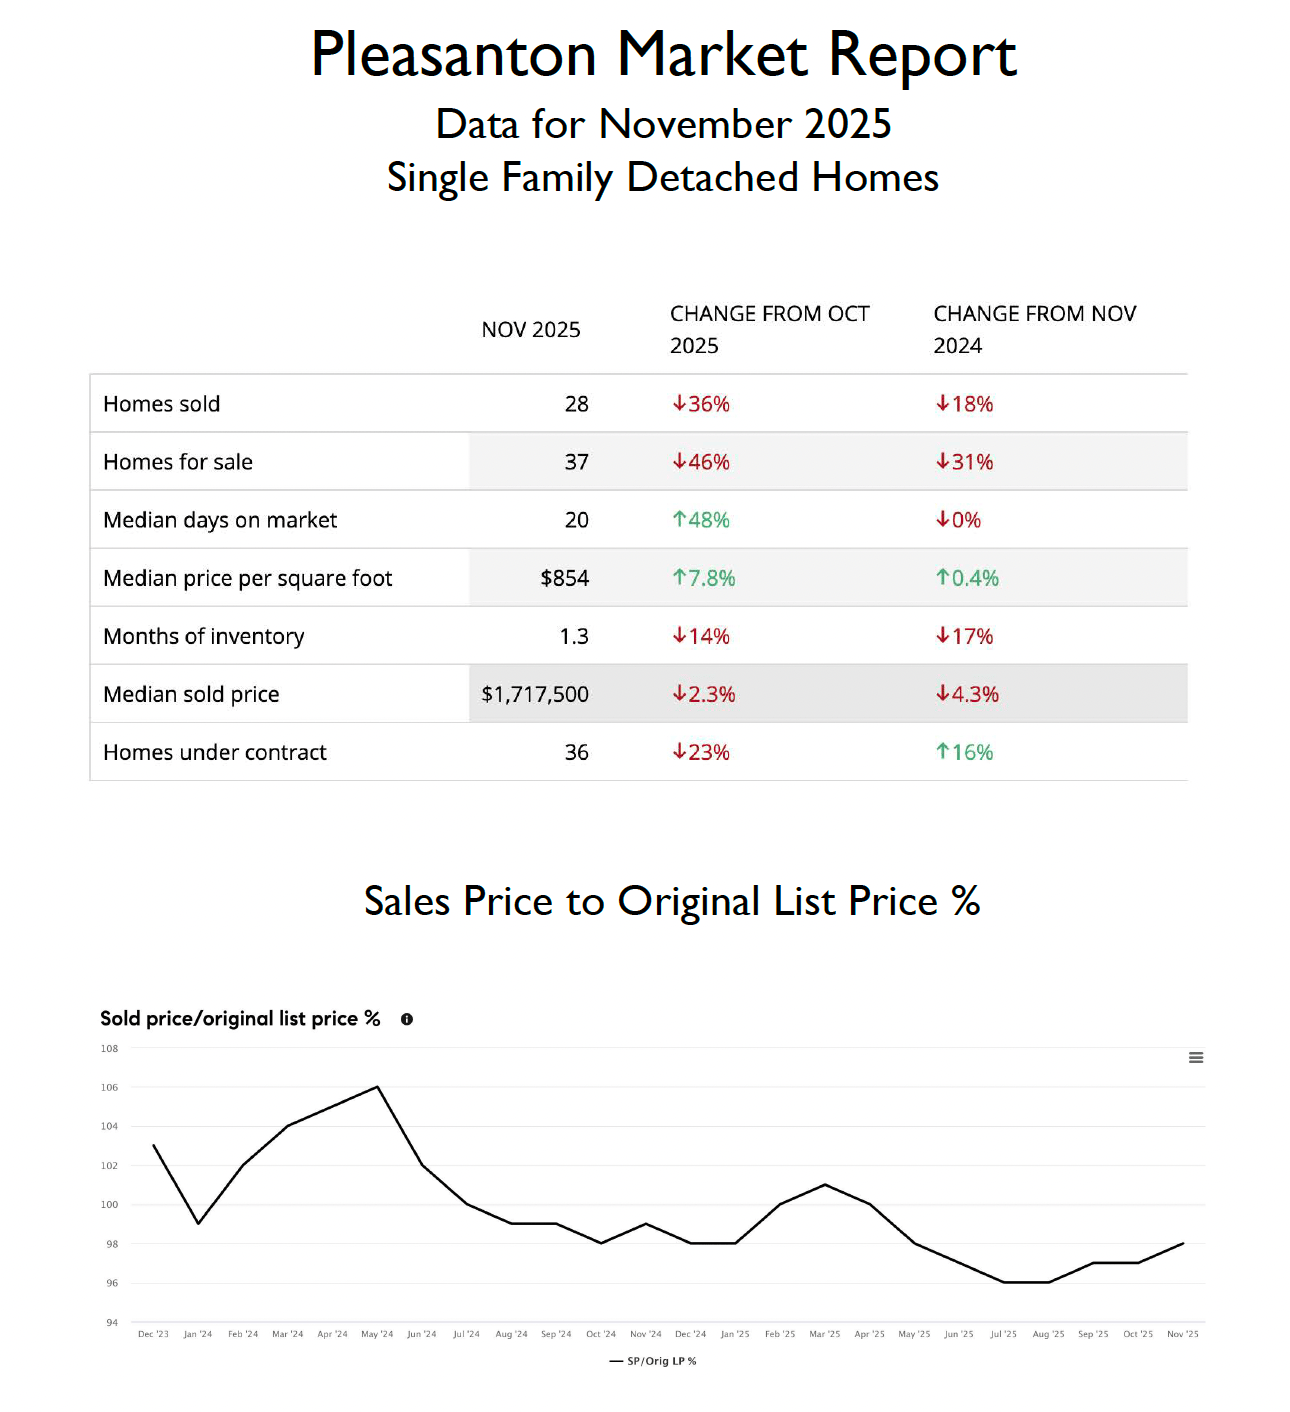
Inventory Slides: The inventory of available single-family homes dropped by about half, with 37 homes for sale at the end of November, a 46% decrease from the 64 homes for sale at the end of October and 31% lower than November of last year. This is normal as we enter the holidays, and this year seems to follow that trend. Lower inventory means fewer choices for buyers, and in some cases may put pressure on buyers to make stronger offers if they are motivated to close before the end of the year
Demand Softens: Pending sales (homes under contract) also slid in November, with 36 pending sales for the month, down 23% from October’s figure of 48. This is 16% higher than November of last year. Closed sales were also down, showing a 36% drop in November with 36 closings, down from 43 closed sales in October. This is also down 18% from November of last year. Median days on market for closed sales in November was 20, a 48% increase over October’s number of 14 and unchanged from November of 2024. Median days on market for Active listings in Pleasanton stands at 69, showing that most homes are simply taking longer to sell.
Price Data is Mixed: The median sold price in November was $1,717,500, down 2.3% from October’s number of $1,765,000. This is also 4.3% lower than November of 2024. However, the median sold price per sq ft rose to $854, a 7.8% increase over October. It was also up slightly from November of 2024. For added perspective, the average sold price per sq ft earlier this year was $884 per sq in March, $866 in April, and $864 in May. The average sales price to lists price ratio, another gauge on the strength of the market, rose slightly to 98%, which indicates that on average most homes are selling 2% below their asking price. For reference, the peak of sales price to list price ratio was 101% in March. However, because this is an average, the reality is that many homes sell close to or even over asking, and others sit on the market with price reductions. Indeed, approximately 37% of the current listings have had price reductions.
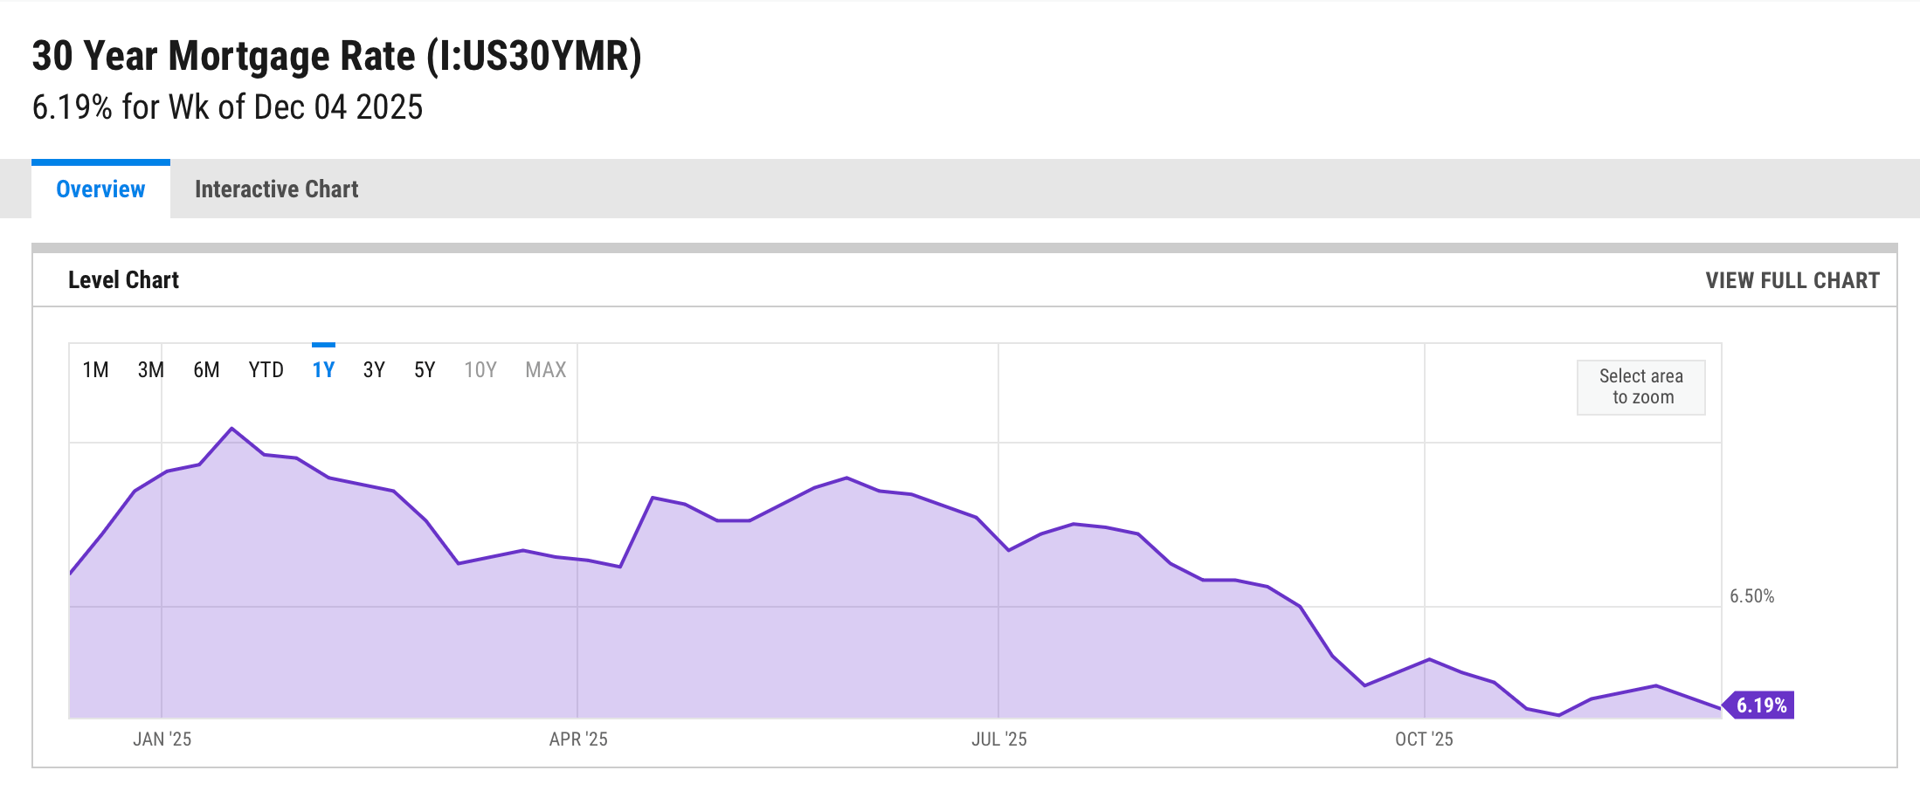
Interest Rates Drift Downward: Average 30-year fixed mortgage rates continued to drift downward, dropping to 6.19%, which is down almost 1% from the high of 7.04% in January of this year. Interest rates of course have a major impact on the real estate market. Hopefully we will see them continue to drift downward.
Economic/Other Considerations: The economy continues to show mixed signals. Inflation remains manageable, although a bit higher than the Fed’s target rate. All eyes are on the Fed and their decision on the federal funds rate this month. The stock market remains very strong with periods of volatility. There is concern about unemployment, especially in the tech sector of the Bay Area. And interest rates, specifically mortgage rates, remain stubbornly high, but have trended lower since mid-Summer. Everyone is hoping we can see mortgage rates ease further, which should add some strength to the housing market. Fingers crossed…
Stay up to date on the latest real estate trends.

Market Update
Doug Buenz | July 21, 2026
More Inventory, Selective Buyers, and Uneven Results for Sellers

Market Trends
Doug Buenz | July 21, 2026
Single-family home activity included in the MLS snapshot from June 15 through July 20, 2026

Pleasanton Neighborhoods
Doug Buenz | July 10, 2026
Compare Pleasanton's most popular neighborhoods by home prices, architectural styles, commute access, parks, recreation, and local amenities to find the community that… Read more

Neighborhood Guide
Doug Buenz | July 4, 2026
Pleasanton CA Neighborhoods: Complete Guide to Every Community (2026)
Market Trends
Doug Buenz | June 15, 2026
39% of Pleasanton Homes Sold Over Asking in May. Here's the Rest of the Story.

Market Trends
Doug Buenz | May 8, 2026
Mixed Signals Persist in the Pleasanton Market
Market Trends
Doug Buenz | April 9, 2026
Mixed Signals in the Pleasanton Market
Market Trends
Doug Buenz | December 10, 2025
Holiday Hibernation

Market Trends
Doug Buenz | October 9, 2025
A Fall Rally?