Pleasanton May 2025 Real Estate Update
Market Trends
Market Trends
The Pleasanton real estate market saw slower activity in April, largely due to the turbulence in our economy over tariffs and the corresponding stock market correction. Inventory climbed higher and sales activity slowed, with buyers showing more caution.
Let’s take a dive into the numbers for April:
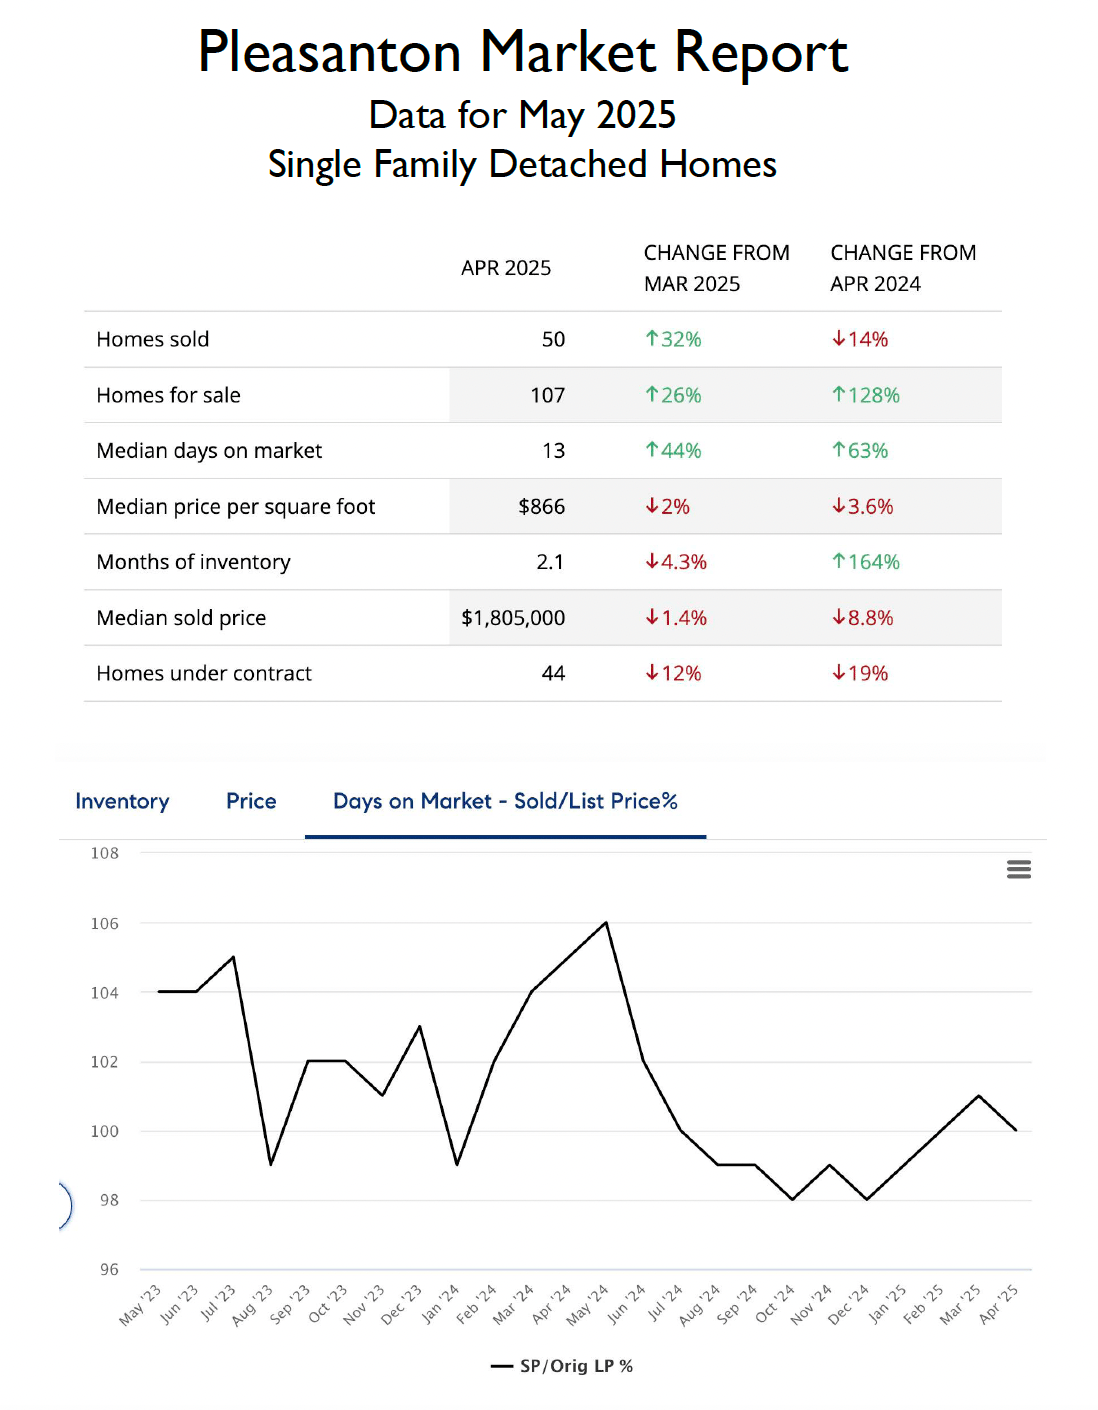
Supply/Inventory: The inventory of available single-family homes increased to 107 homes for sale, the highest level we have seen in almost 3 years. This represents a 26% increase over last month (March) and a 128% increase over April of 2024. For context, there were 58 single family homes on the market at the end of February, so inventory has nearly doubled. While it is normal to see inventory climb in the Spring, we are seeing a more balanced market as opposed to the strong sellers’ market we have seen since COVID.
Demand: Pending sales (homes under contract) were lower in April, with 44 homes under contract for the month. This is 12% lower than March’s number, and 19% lower than April of 2024. Closed sales were up in April, showing 50 sales, which is 32% higher than March’s figure of 38. This is the positive result of more inventory, where buyers have more choices in the market. However, closed sales were 14% lower than April of 2024. Median days on market increased to 13 in April, which is up 44% from March’s figure, and 63% higher than April of 2024.
Prices: Both the median price per sq ft and the median sold price were lower in April. The median price per sq ft in April was $866 per sq ft, which is 2% lower than March’s figure of $884. It is also 3.6% less than April of 2024. The median sold price was also lower at $1,805,000, which is 1.4% lower than March and almost 9% lower than April of last year.
The average sales price to list price ratio in April dropped to 100%, which is down from 101% in March. Still, it demonstrates that some homes that are priced well still sell quickly and often above the asking price with multiple offers, while others sell below asking. For context, if homes are selling on average for their asking price (100%) it would indicate a strong market. The highest ratio of sales price to list price was in May of last year, where homes on average sold for 106% of the list price.
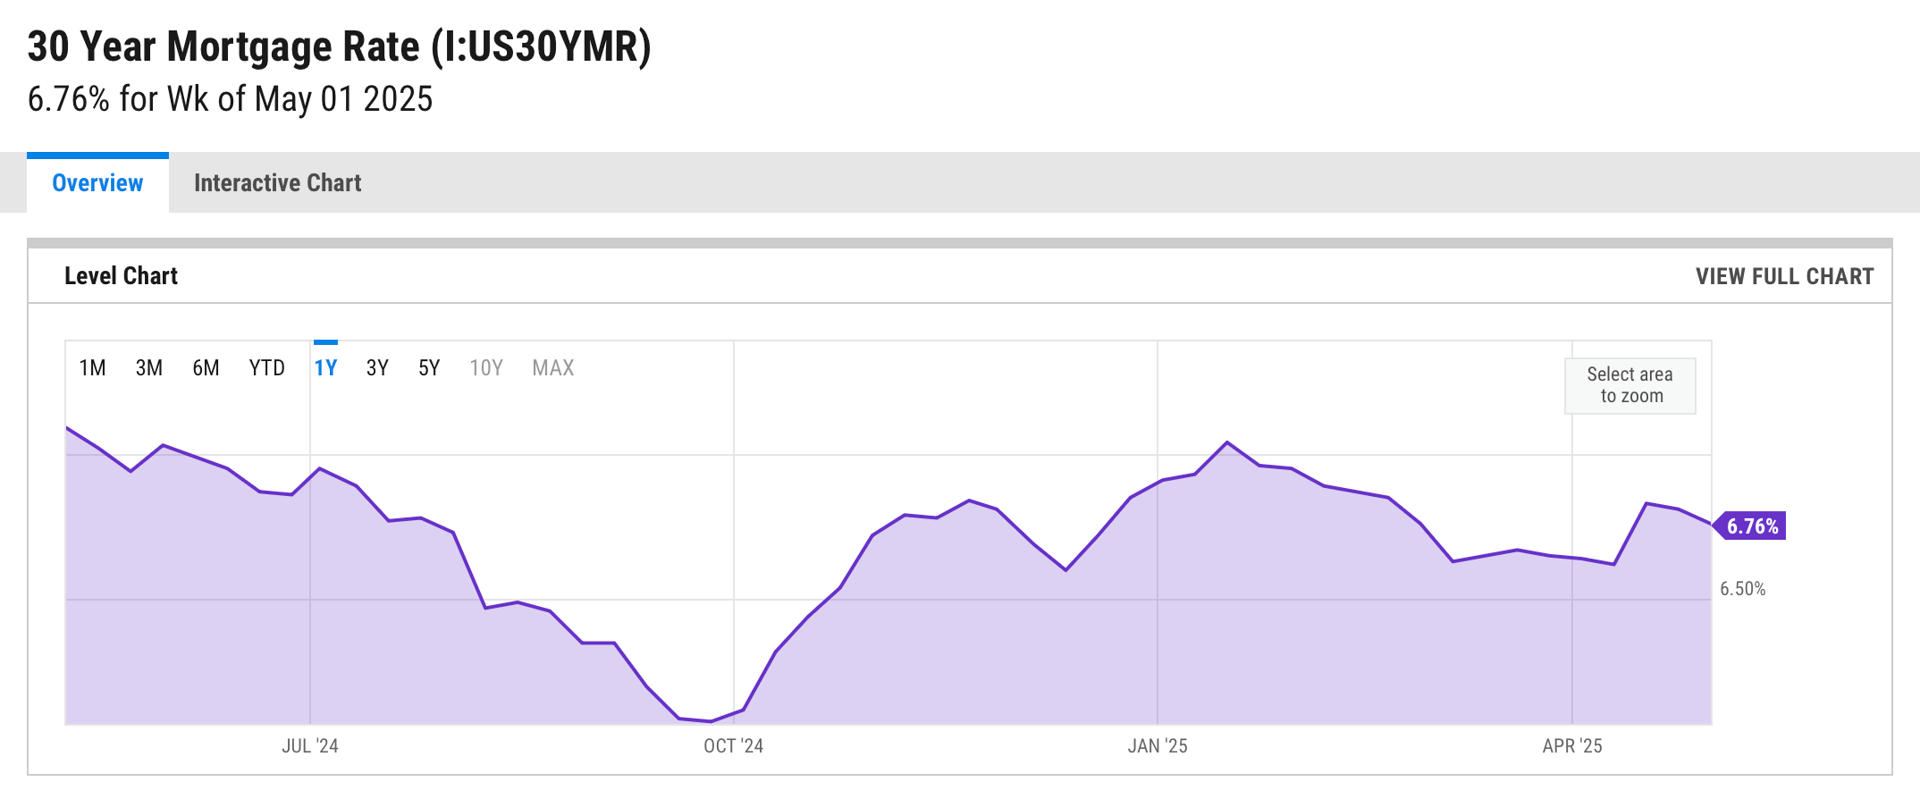
Interest Rates: Average 30-year fixed mortgage rates have remained stubbornly high, sitting at 6.76%, which is up almost 3/4% from October of last year’s low point of 6.08%. Interest rates remain the key driver for the real estate market. We will see how the recent market turbulence impacts rates moving forward
Economic/Other Considerations: To say the capital markets were turbulent in early April is an understatement. The stock market reacted strongly to the uncertainty in the outlook for trade and economic growth. The bond market also showed volatility. For mortgage rates, it is all about inflation and growth/recession. Concerns about inflationary pressures of tariffs kept rates high. Here’s hoping things stabilize so we can see continued progress on inflation, and thus interest rates.
Stay up to date on the latest real estate trends.

Market Trends
Doug Buenz | July 21, 2026
Single-family home activity included in the MLS snapshot from June 15 through July 20, 2026

Pleasanton Neighborhoods
Doug Buenz | July 10, 2026
Compare Pleasanton's most popular neighborhoods by home prices, architectural styles, commute access, parks, recreation, and local amenities to find the community that… Read more

Doug Buenz | July 4, 2026
Pleasanton CA Neighborhoods: Complete Guide to Every Community (2026)
Market Trends
Doug Buenz | June 15, 2026
39% of Pleasanton Homes Sold Over Asking in May. Here's the Rest of the Story.
Market Trends
Doug Buenz | May 8, 2026
Mixed Signals Persist in the Pleasanton Market
Market Trends
Doug Buenz | April 9, 2026
Mixed Signals in the Pleasanton Market
Market Trends
Doug Buenz | December 10, 2025
Holiday Hibernation
Market Trends
Doug Buenz | October 9, 2025
A Fall Rally?
Market Trends
Doug Buenz | August 9, 2025
A Sluggish Summer